Outline of the vicarious calibration approach
The Meteorological Satellite Center examines ways to improve vicarious calibration for visible and near-infrared bands of geostationary imagers. This type of calibration is performed to rebuild visible calibration coefficients, and the related approach relies on radiative transfer calculation. Reflectivity at each observation location is simulated under atmospheric and geometric conditions corresponding to those of satellite observation. Calibration coefficients are computed using regression analysis for an appropriate number of pairs of observated and simulated reflectivity values.
Radiative transfer calculation requires data of atmospheric profiles, aerosol and cloud optical parameters, and observation geometries. The input data are created from JMA's Re-Analysis (JRA) data, total column ozone L3 data (OMI: Ozone Monitoring Instrument; OMPS: Ozone Mapping and Profiler Suite), and Moderate Resolution Imaging Spectroradiometer (MODIS) L1B data (Collection 5/6).
Ozone L3 and MODIS L1B data are collected via the Internet. Vicarious calibration computation may be suspended in the event of data download failure.
History of input data
- Himawari-8/AHI
- JRA-55 (until October 2022), JRA-3Q (from November 2022 onward)
- Aura/OMI (until October 2022), S-NPP/OMPS (from November 2022 onward)
- MODIS C5 (until February 2017), C6 (from April 2015 onward)
- Himawari-9/AHI
- JRA-55 (until October 2018), JRA-3Q (from September 2022 onward)
- Aura/OMI (until October 2018), S-NPP/OMPS (from September 2022 onward)
- MODIS C6 (until February 2023), C61 (from March 2023 onward)
Outcomes
The results of vicarious calibration consist of a set of regression parameters.
Linear regression coefficients (C0 and C1) to associate nominal reflectivity with calculated values are computed. C0 and C1 are defined by
"Reflectivitynominal" is reflectivity converted from digital count data based on calibration information in a header part of disseminated data. The calibration table for MTSAT-2 is available here. Himawari Standard Data from Himawari-8 and 9 (HSD User's guide) has calibration coefficients in the header block rather than being presented in a calibration table. Reflectivity is expressed using a dimensionless number, and is given by
where F0 is the solar incident irradiance for each band of each sensor (Table 1). The F0 value for MTSAT-2 is based on the HRIT calibration table (Excel sheet file) (Neckel and Labs, 1984) (Rossow et al., 1985). The F0 value adopted for HSD is based on (Kurucz, 1995). The radiance is a value for Spectral Response Function (SRF) of each band with the unit [W/m2/sr/µm].
| Visible 0.675 µm | |
|---|---|
| MTSAT-2/ IMAGER |
1498.24 |
| Band 1 0.47 µm |
Band 2 0.51 µm |
Band 3 0.64 µm |
Band 4 0.86 µm |
Band 5 1.6 µm |
Band 6 2.3 µm |
|
|---|---|---|---|---|---|---|
| Himawari-8 /AHI |
2015.3606 | 1891.1653 | 1631.5726 | 971.8778 | 242.3462 | 75.1353 |
| Himawari-9 /AHI |
2015.3241 | 1891.3660 | 1629.4697 | 971.7920 | 243.6280 | 75.1127 |
Methodology
Target selection
To reduce uncertainty, radiative transfer calculation needs to be performed for a spatially uniform and temporally stable area. Observed images are therefore separated into grids, and simulation is performed only for spatially uniform grids. The grid size is 0.05 by 0.05 degrees for MTSAT-2 and 0.02 by 0.02 degrees for Himawari-8. Such grids are referred to here as targets, and it is preferable to cover a wide range of radiances to allow the creation of a reliable regression line. This approach involves the use of cloud-free ocean surface, cloud-free land surface and spatially uniform water cloud top data as dark, medium and bright targets, respectively. Simulation requires inputs corresponding to each target.
Simulation
-
Radiative transfer code
RSTAR radiative transfer code developed by the Atmosphere and Ocean Research Institute at The University of Tokyo (Nakajima and Tanaka, 1988) is employed for simulation. This approach requires information on atmospheric profiles, total column ozone amount, surface reflectivity, optical parameters of scattering particles and viewing geometry. The input for radiative transfer calculation must be independent of Himawari observation data. In this approach, therefore, atmospheric profiles and ozone amounts are based on JMA NWP data and total column ozone data, respectively. Scattering objects are aerosols (for cloud-free ocean and cloud-free land targets) and cloud particles (for water cloud top targets). The optical parameters of scattering particles are obtained from MODIS L1B data (Terra for MTSAT-2, Terra and Aqua for Himawari-8 and 9).
In this approach, the SRF is approximated by 40 points in consideration of the trade-off between computation cost and accuracy.
| Visible 0.675 µm | |
|---|---|
| MTSAT-2/ IMAGER |
1518 |
| Band 1 0.47 µm |
Band 2 0.51 µm |
Band 3 0.64 µm |
Band 4 0.86 µm |
Band 5 1.6 µm |
Band 6 2.3 µm |
|
|---|---|---|---|---|---|---|
| Himawari-8 /AHI |
1997 | 1890 | 1632 | 990.2 | 244.4 | 71.52 |
| Himawari-9 /AHI |
1997 | 1890 | 1632 | 987.9 | 245.6 | 71.40 |
-
Simulation for cloud-free ocean targets
For cloud-free ocean targets, data on sea surface reflectivity and aerosol optical parameters are necessary in addition to atmospheric profile data and ozone total amounts as input for radiative transfer calculation. RSTAR can be used to retrieve sea surface reflectivity data from sea surface wind speed figures. This approach utilizes sea surface wind speed information contained in JMA NWP model data. Aerosol optical thickness and Ångström exponent are retrieved from MODIS L1B data using REAP aerosol analysis package (Higurashi and Nakajima 1999). REAP computes aerosol optical parameters from two bands of satellite data (visible and near-infrared). This approach utilizes MODIS bands 1 (645 nm) and 2 (858 nm). The aerosol absorption/scattering parameters are based on non-absorption characteristics (Higurashi and Nakajima 2002).
NASA’s MODIS aerosol products (known as MOD04 and MYD04) can be used as simulation input data instead of REAP-retrieved aerosol data. However, the radiative transfer code used to retrieve aerosol data from MODIS L1B and that used to calculate simulated reflectivity should be consistent in order to ensure accurate simulation. As the radiative transfer algorithm included in REAP is the same as that of RSTAR, this approach adopts REAP-retrieved aerosol data instead of NASA’s MODIS aerosol products.
Radiative transfer computation should be performed in consideration of water-leaving radiance for visible bands with a shorter wavelength. Accordingly, this target area is not used, and the intercept value C0 in the regression process discussed below is provisionally assumed to be zero for bands 1 and 2.
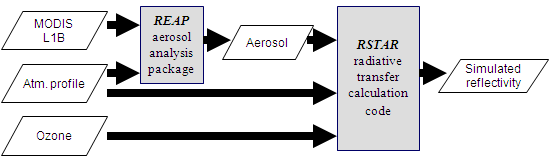
|
| Fig. 1: Input data for radiative transfer calculation with cloud-free ocean targets. The aerosol optical parameters are retrieved from MODIS L1B. |
|---|
-
Simulation for cloud-free land targets
The land targets are bare-soil areas near Alice Springs and Tennant Creek in Australia. The key elements for cloud-free land targets are ground surface reflectivity and aerosol optical thickness. As retrieving aerosol optical thickness data from satellite observation of land areas generally involves uncertainty, climate data are adopted as aerosol optical parameters. The Bidirectional Reflectivity Distribution Function (BRDF), which shows reflectivity corresponding to incoming and outgoing directions, is used to support accurate estimation of ground surface reflectivity. In this approach, NASA’s MODIS BRDF product is utilized to allow consideration of ground surface anisotropy. This product provides parameters to enable characterization of ground surface reflectivity depending on geometry information. It supplies parameters for the seven MODIS bands from visible to shortwave infrared and three broad bands. Ground surface reflectivity data for the seven MODIS bands are interpolated depending on the SRF of MTSAT-2/IMAGER or Himawari-8 and 9/AHI and input to the radiative transfer code.
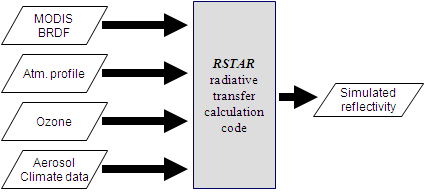
Fig. 2: Input data for radiative transfer calculation with cloud-free land targets -
Simulation for water cloud targets
Cloud parameters such as optical thickness and effective radius are dominant factors for water cloud targets. These parameters are obtained from MODIS L1B data using CAPCOM cloud analysis package (Nakajima and Nakajima, 1995). CAPCOM computes cloud optical parameters using satellite data from the thermal infrared band, the non-absorption band and the absorption band. This approach utilizes three MODIS bands, band 31 (11.03 µm) as thermal infrared and band 1 (645 nm) as non-absorption. MODIS band 7 (2.130 µm) is used as the absorption band for validation of AHI bands 5 (1.6 µm) and 6 (2.3 µm). This is because it is preferable to adopt an absorption band with a wavelength close to that of the AHI band to be validated, and 70 percent of the band 6 (1.640 µm) detectors on board Aqua/MODIS are currently non-operational (e.g. link). For other AHI and MTSAT-2 visible bands, the absorption band is MODIS band 20 (3.750 µm). The radiative transfer algorithm included in CAPCOM is consistent with that of RSTAR. It supports accurate simulation as mentioned above for ocean targets. For this target type, the scattering object consists of water cloud particles rather than aerosols.
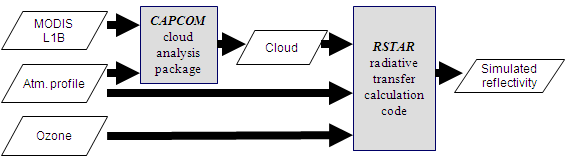
Fig. 3: Input data for radiative transfer calculation with water cloud targets. The cloud optical parameters are retrieved from MODIS L1B.
Regression
Simulated reflectivity is compared with observed nominal reflectivity.
The linear regression coefficients are the calibration adjustment coefficients
C0 and C1 in (1), and are obtained from 30-day data in this approach.
Radiative Transfer Calculation Accuracy
To evaluate the accuracy of this approach, the simulated radiances for the three target types are compared with MODIS radiance. MODIS carries onboard calibrators for visible bands to ensure that observation data are well calibrated and reliable. The input factors for the radiative transfer code are the same as those for the aforementioned simulation, e.g., aerosol and cloud optical parameters retrieved from MODIS L1B.
Figure 4 shows correspondence between simulated radiance and MODIS observed radiance. The error between the two is less than 1%, indicating that the methodology is sufficiently reliable.
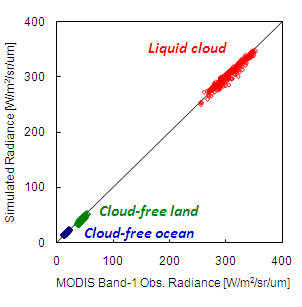
|
| Fig. 4: Correspondence between simulated radiance and Terra/MODIS observed radiance. The slope of the regression line is 1.00 and the bias is almost zero. The radiative transfer code can be used to simulate MODIS observed radiance with an error margin of less than 1%. |
|---|
Note
This calibration/validation approach was developed in collaboration with Prof. Nakajima and his team at The University of Tokyo's the Atmosphere and Ocean Research Institute.
Reference
-
Okuyama, A., T. Hashimoto, R. Nakayama, Y. Tahara, T. Kurino,
H. Takenaka, S. Fukuda, T. Y. Nakajima, A. Higurashi, M. Sekiguchi,
T. Takamura and T. Nakajima, Geostationary Imager Visible Channel Recalibration,
2009 EUMETSAT METEOROLOGICAL SATELLITE CONFERENCE, SESSION 6. Monitoring climate
and understanding climate processes with satellites, ISBN 978-92-9110-086-6
(PDF, 302 kB)
-
Solar irradiance
Kurucz, R.L., The Solar Irradiance by Computation, Proceedings of the 17th Annual Review Conference on Atmospheric Transmission Models edited by Anderson, G.P., Picard, R.H. and Chetwynd, J.H., PL/-TR-95-2060, Special Reports, No. 274, pp. 333-334, Phillips Laboratory/Geophysics Directorate, MA, May 1995
Neckel, H. and D. Labs, The solar radiation between 3300 and 12500 A, Solar Physics 90, 205 (1984)
Rossow, W.B., E. Kinsella, A. Wolf and L. Gardner, Description of reduced radiance data, International Satellite Cloud Climatology Project (ISCCP), WMO/TD-No. 58 (1985)
-
RSTAR
Nakajima, T. and M. Tanaka, (1988) Algorithms for radiative intensity calculations in moderately thick atmospheres using a truncation approximation, J. Quant. Spec. Rad. Trans., 40, pp. 51-69
-
REAP
Higurashi, A. and T. Nakajima, (1999) Development of a Two Channel Aerosol Retrieval Algorithm on Global Scale Using NOAA/AVHRR., J. Atmos. Sci., 56, pp 924?941
Higurashi, A. and T. Nakajima, (2002) Detection of aerosol types over the East China Sea near Japan from four-channel satellite data., Geophys. Res. Lett., 29, pp. 1836-1839
-
CAPCOM
Nakajima, T.Y. and T. Nakajima, (1995) Wide area determination of cloud microphysical properties from NOAA AVHRR measurement for FIRE and ASTEX regions, J. Atmos. Sci., 52, pp. 4043-4059
-
The RSTAR, REAP and CAPCOM tools are available on
OpenCLASTR website
of the Atmosphere and Ocean Research Institute at The University of Tokyo.