Methane (CH4) is the most significant greenhouse gas after CO2, and is emitted into the atmosphere from various sources including wetlands, rice paddy fields, ruminant animals, natural gas production and biomass burning. CH4 is primarily removed from the atmosphere by photochemical reaction with very reactive and unstable hydroxyl (OH) radicals.
The results of WDCGG analysis show that the global mean annual atmospheric CH4 mole fraction was 1,934 ppb in 2023, an increase of 11 ppb from the previous year. This is 165% higher than the pre-industrial level (about 729 ppb).
JMA observes surface concentrations of methane (CH4) at three stations in Japan (observation at Yonagunijima ended in March 2024).
The upper panel of the figures below shows a time-series representation of CH4 mole fractions at these stations, and the lower panel shows growth rates. The mole fraction at Ryori is higher than those at the other two stations because the station is located at a higher latitude. The values are generally higher at Yonagunijima than those at Minamitorishima despite the almost identical latitudes of the two locations. This reflects the influence of anthropogenic emissions from the Asian continent, especially from autumn to spring.
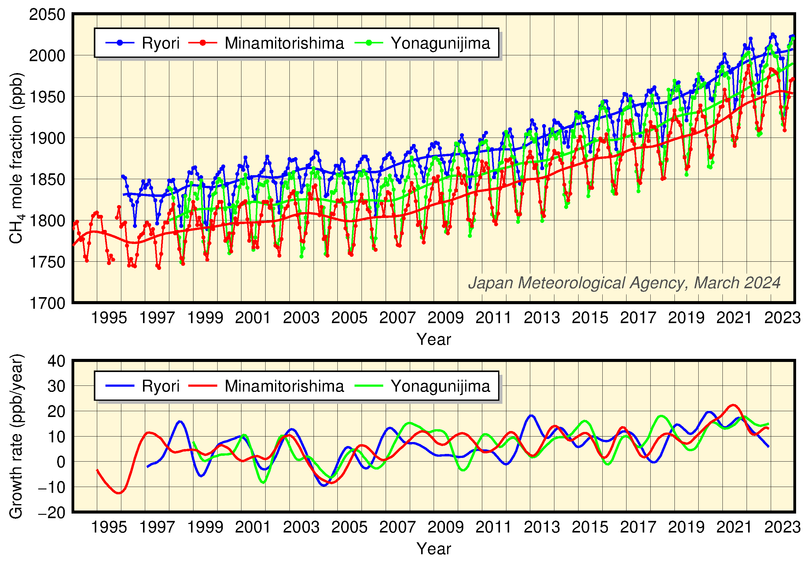
Monthly mean concentrations (upper panel) and corresponding growth rates (lower panel) of atmospheric CH4 observed at JMA observatories
In the upper panel, monthly mean concentrations and those with seasonal variations removed are shown.
Provisional values are included.
Observation at Yonagunijima ended in March 2024.
The figure below shows a time-series representation of globally averaged CH4 mole fractions as analyzed by the WDCGG using statistical methods.
Values show an increasing tendency except in the early 2000s.
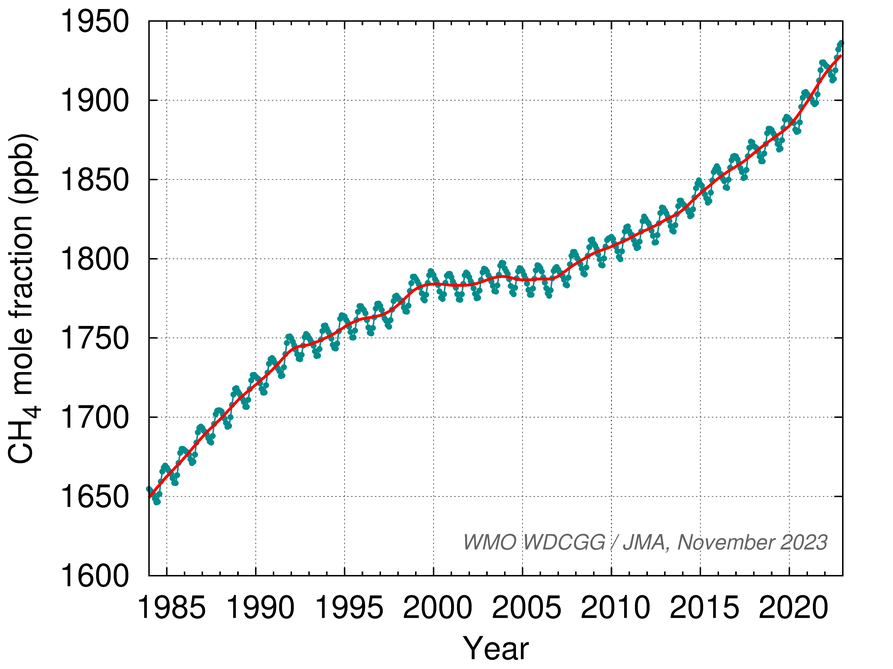
Global mean concentration of atmospheric CH4
Blue: monthly mean concentration. Red: monthly mean with seasonal variations removed.
The figure below shows variations in zonally averaged atmospheric CH4 mole fractions analyzed using data submitted to the WDCGG from fixed stations and some ships. The values decline southward from mid and high latitudes of the Northern Hemisphere. As CH4 sources are mainly terrestrial, the Northern Hemisphere has a larger impact on related variations than the Southern Hemisphere.
Growth rates were generally lower in the 1990s than in the 1980s, when global mean CH4 mole fractions increased with greater emissions from anthropogenic sources such as agricultural and industrial activity. The trend was rather flat from 1999 to 2006, suggesting a balance between CH4 removal and emission. Values have shown an increase again since 2007, but the mechanism behind this trend is not fully understood. Against such a background, CH4 variations need to be monitored closely.
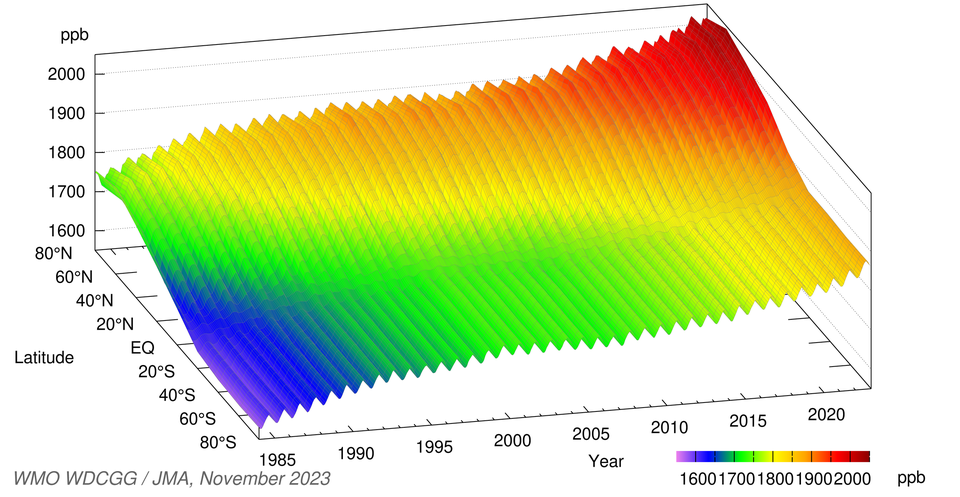
Latitudinal distribution of atmospheric CH4 concentrations