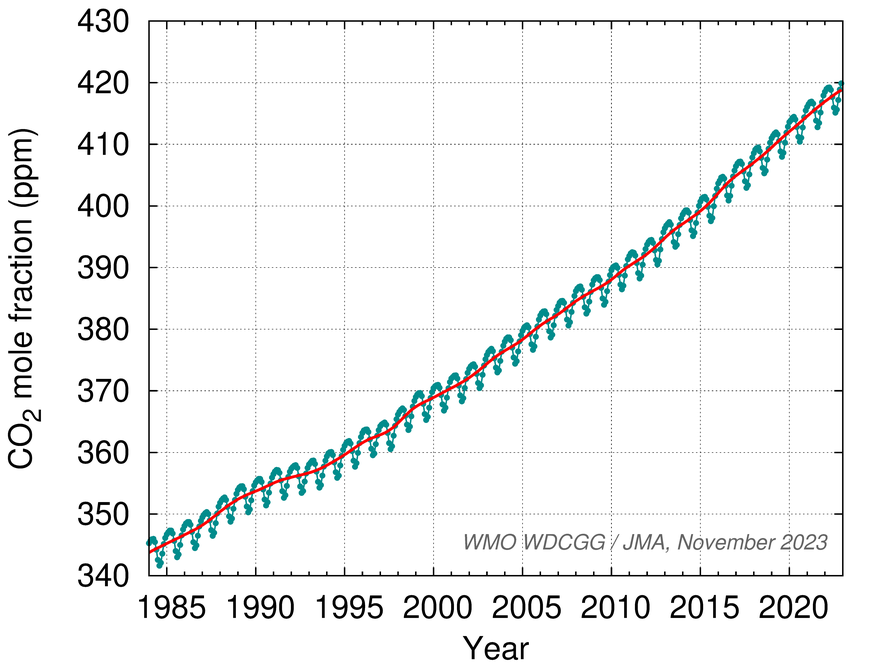
Among greenhouse gases, carbon dioxide (CO2) is the most significant contributor to global warming. Its atmospheric concentration has increased in recent times as a result of emissions from various human activities such as fossil-fuel combustion, cement production and deforestation. Among these activities, the combustion of fossil fuels accounts for about three quarters of all anthropogenic CO2 emissions. The results of WDCGG analysis show that the global mean annual atmospheric CO2 mole fraction was 420.0 ppm in 2023, an increase of 2.3 ppm from the previous year. This is 51% higher than the pre-industrial level (about 278 ppm).
JMA observes surface concentrations of CO2 at three stations in Japan (observation at Yonagunijima ended in March 2024).
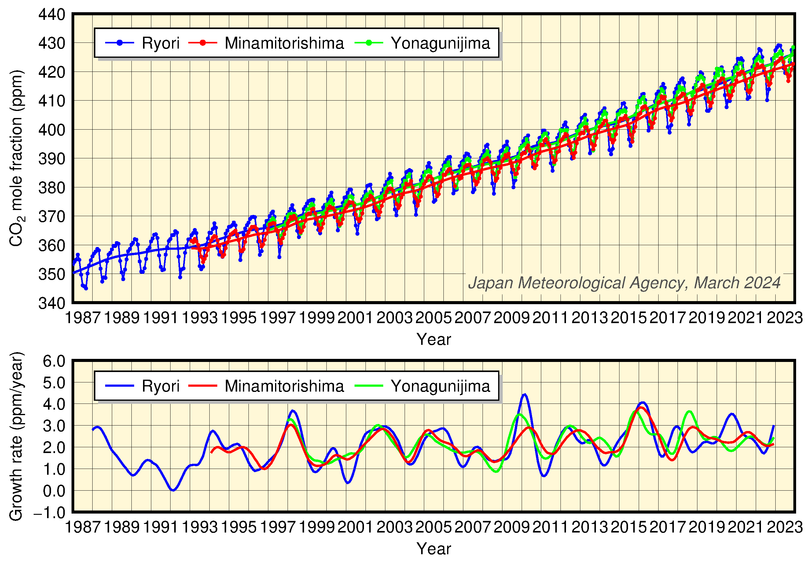
The upper panel of the figures below shows a time-series representation of CO2 mole fractions at these stations. In all data, values vary with a seasonal cycle in relation to photosynthesis and respiration in the biosphere. The mole fraction at Ryori has larger seasonal variations than those at the other two stations because the station is located at a higher latitude, where the atmosphere is significantly influenced by biospheric activity. The values are generally higher at Yonagunijima than those at Minamitorishima despite the almost identical latitudes of the two locations. This reflects the influence of anthropogenic and wintertime biospheric emissions from the Asian continent.
The increases in CO2 mole fractions at all three stations show almost simultaneous variations, as seen in the lower panel of the figure below. It is well known that annual variations in CO2 mole fractions are related to the El Niño-Southern Oscillation; the El Niño events in 1986-1988, 1997/1998, 2002/2003, 2009/2010 and 2014-2016 coincided with high growth rates of CO2.

Monthly mean concentrations (upper panel) and corresponding growth rates (lower panel) of atmospheric CO2 observed at JMA observatories
In the upper panel, monthly mean concentrations and those with seasonal variations removed are shown.
Provisional values are included.
Observation at Yonagunijima ended in March 2024.
The figure below shows a time-series representation of globally averaged CO2 mole fractions as analyzed by the WDCGG using statistical methods.
The increase observed in the values corresponds to the results of JMA observations.

Global mean concentration of atmospheric CO2
Blue: monthly mean concentration. Red: monthly mean with seasonal variations removed.
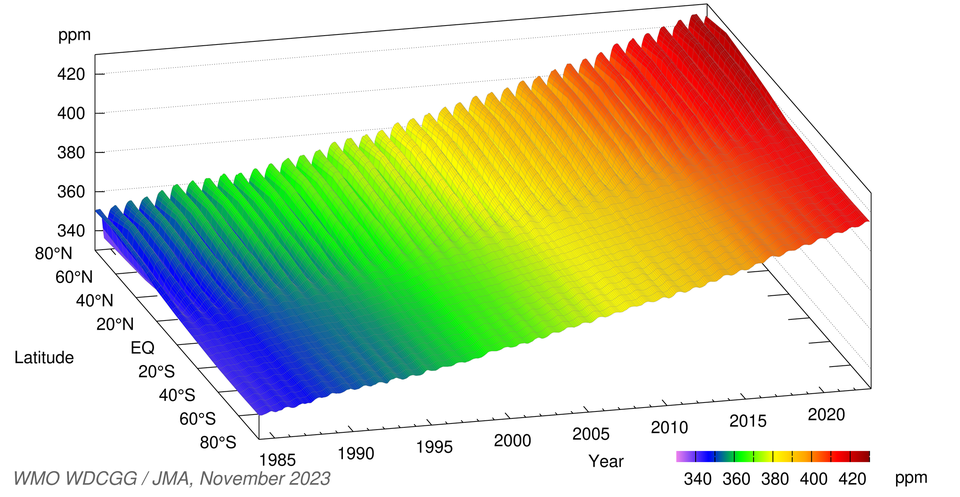
The figure below shows variations in zonally averaged atmospheric CO2 mole fractions analyzed using data submitted to the WDCGG from fixed stations and some ships. The values are high in mid and high latitudes of the Northern Hemisphere, and decrease toward southerly latitudes. This latitudinal distribution of CO2 mole fractions suggests that major CO2 sources are located in the mid and high latitudes of the Northern Hemisphere. The seasonal variation (a decrease from spring to summer and an increase from summer to spring) is mainly characterized by the activity of the terrestrial biosphere, and its amplitude in the Southern Hemisphere is smaller than that in the Northern Hemisphere due to the smaller land area of the former. In both hemispheres, atmospheric CO2 mole fractions increase year by year.

Latitudinal distribution of atmospheric CO2 concentrations
The results of JMA's global CO2 distribution analysis can be accessed at "Carbon Dioxide (CO2) Distribution".