GTSPP Data Product CentreGTSPP Data Product Centre
GTSPP Data Product Centre for the North Pacific Region hosted by the Japan Meteorological Agency
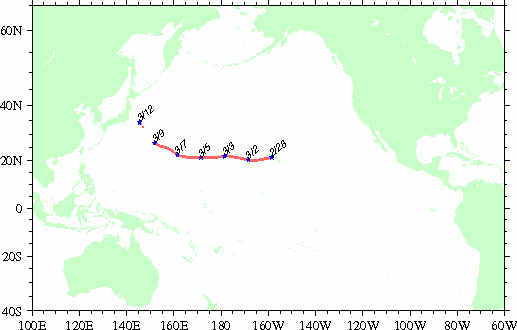
MIYAGI-MARU(JCHQ), PX40
Observation period : 2014/2/28 to 2014/3/12
Observation period : 2014/2/28 to 2014/3/12
This page shows results for the PX40 line based on monitoring by the MIYAGI-MARU and comparison with the result of assimilation by MOVE-NP.
Overall statistics
| Number of profiles | Number of data | AVE | RMSD | MAXD | MIND |
|---|---|---|---|---|---|
| 100 | 30863 | -0.00 | 0.62 | 3.80 | -3.39 |
Abbreviations in the table indicate:
AVE: average difference (observation value minus assimilation value)
RMSD: root mean square of difference
MAXD: maximum difference
MIND: minimum difference
Statistics for each depth range
| Depth range | Number of data | AVE | RMSD | MAXD | MIND |
|---|---|---|---|---|---|
| 0-50 | 2500 | 0.12 | 0.58 | 0.93 | -1.13 |
| 50-100 | 2500 | -0.11 | 0.99 | 1.22 | -2.84 |
| 100-150 | 2500 | -0.24 | 1.03 | 3.17 | -3.39 |
| 150-200 | 2500 | 0.05 | 0.84 | 3.78 | -2.59 |
| 200-250 | 2500 | 0.03 | 0.60 | 3.80 | -2.64 |
| 250-300 | 2500 | -0.02 | 0.52 | 3.19 | -1.63 |
| 300-350 | 2500 | 0.01 | 0.50 | 1.31 | -1.49 |
| 350-400 | 2500 | 0.01 | 0.47 | 1.54 | -1.27 |
| 400-450 | 2500 | 0.03 | 0.44 | 1.82 | -1.15 |
| 450-500 | 2500 | 0.03 | 0.27 | 1.86 | -1.09 |
| 500-550 | 1000 | 0.02 | 0.37 | 2.52 | -1.16 |
| 550-600 | 1000 | 0.03 | 0.30 | 2.31 | -1.14 |
| 600-650 | 992 | 0.02 | 0.27 | 1.78 | -0.86 |
| 650-700 | 990 | 0.03 | 0.23 | 1.46 | -1.08 |
| 700-750 | 990 | 0.02 | 0.20 | 1.46 | -0.92 |
| 750-800 | 891 | 0.03 | 0.00 | 1.48 | -0.75 |
| 800-850 | 0 | - | - | - | - |
| 850-900 | 0 | - | - | - | - |
| 900-950 | 0 | - | - | - | - |
| 950-1000 | 0 | - | - | - | - |
Results of QC
A total of 100 profiles (78112 data, reported by BATHY or TESAC) were received from the MIYAGI-MARU.
The results of JMA quality control are as follows.
The results of JMA quality control are as follows.
- Grounded test
- Position on land test
- Regional range test
- Gradient test
Error data: 0 of 78112
On land: 0 of 100
Invalid position: 0 of 100
Error data (low): 0 of 78112
Error data (high): 0 of 78112
Error data: 0 of 78112
For datails of JMA's quality control procedures, please refer to this page.
Summary of QC
- No errors were detected with JMA's quality control procedures.
- There was no significant bias in comparison with the results of assimilation by JMA.
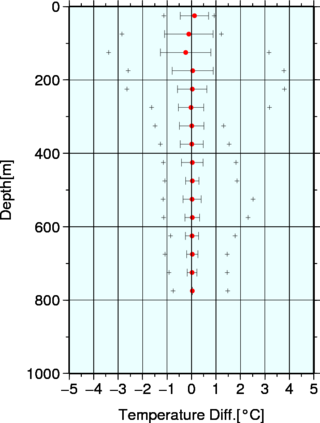
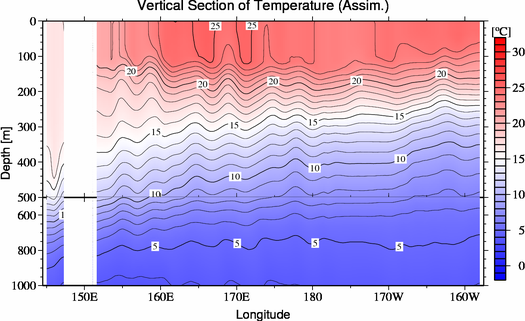
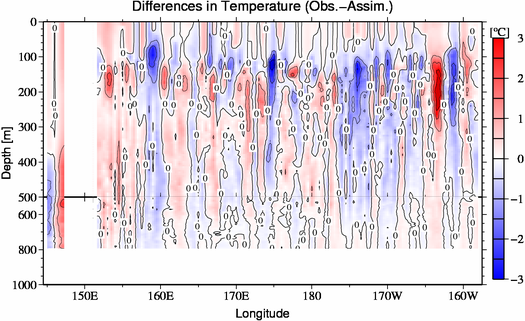
- There were some differences above 2°C between observation data and the results of assimilation at a depth of around 150 m.
Figures
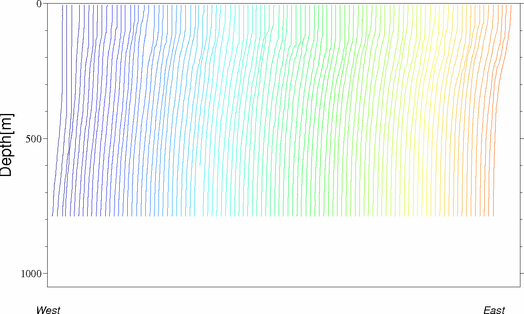
| ◊Station map | ◊Vertical temperature profile Vertical profile of temperature along the observing line of PX40 moved the entire profile by 5 degree Celsius. |
 |
 |
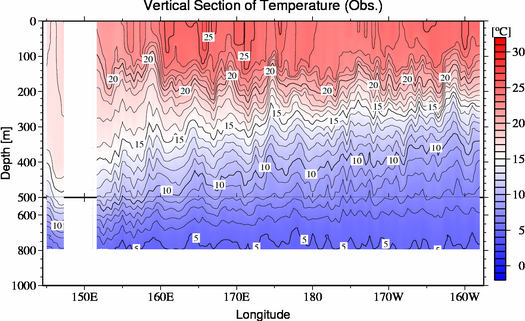
| ◊Vertical observation sections | ◊Summary of differences (Obs. - Assim.) by depth Dots and error bars represent the averages and root mean squares of the differences, respectively. Crosses represent the maximum/minimum differences. |
 |
 |
| ◊Vertical sections for the result of assimilation by MOVE-NP | ◊Distribution of differences (Obs. - Assim.) by depth |
 |
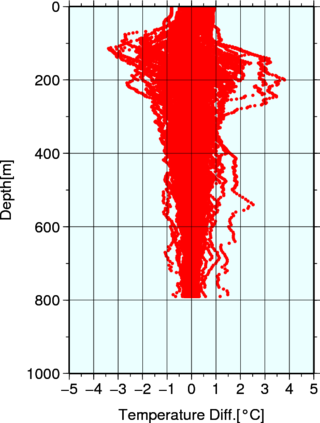 |
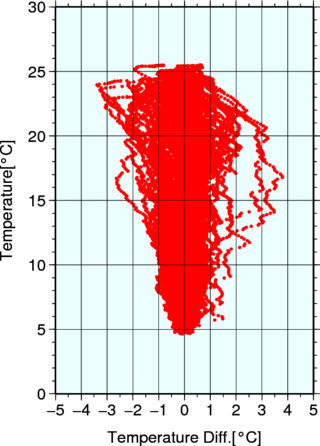
| ◊Vertical sections of differences (Obs. - Assim.) | ◊Distribution of differences (Obs. - Assim.) by temperature |
 |
 |
Correspondence to the web page should be addressed to