Updated on 2 Feb. 2026
Japan Meteorological Agency
Values of pH in surface seawater have shown a clear long-term trend of decrease along the repeat hydrographic lines at 137°E (3°N–34°N) since 1985 and 165°E (5°S–35°N) since 1996. The rate of decrease is approximately 0.02 per decade at each latitude, which is almost the same rate as that for global ocean.
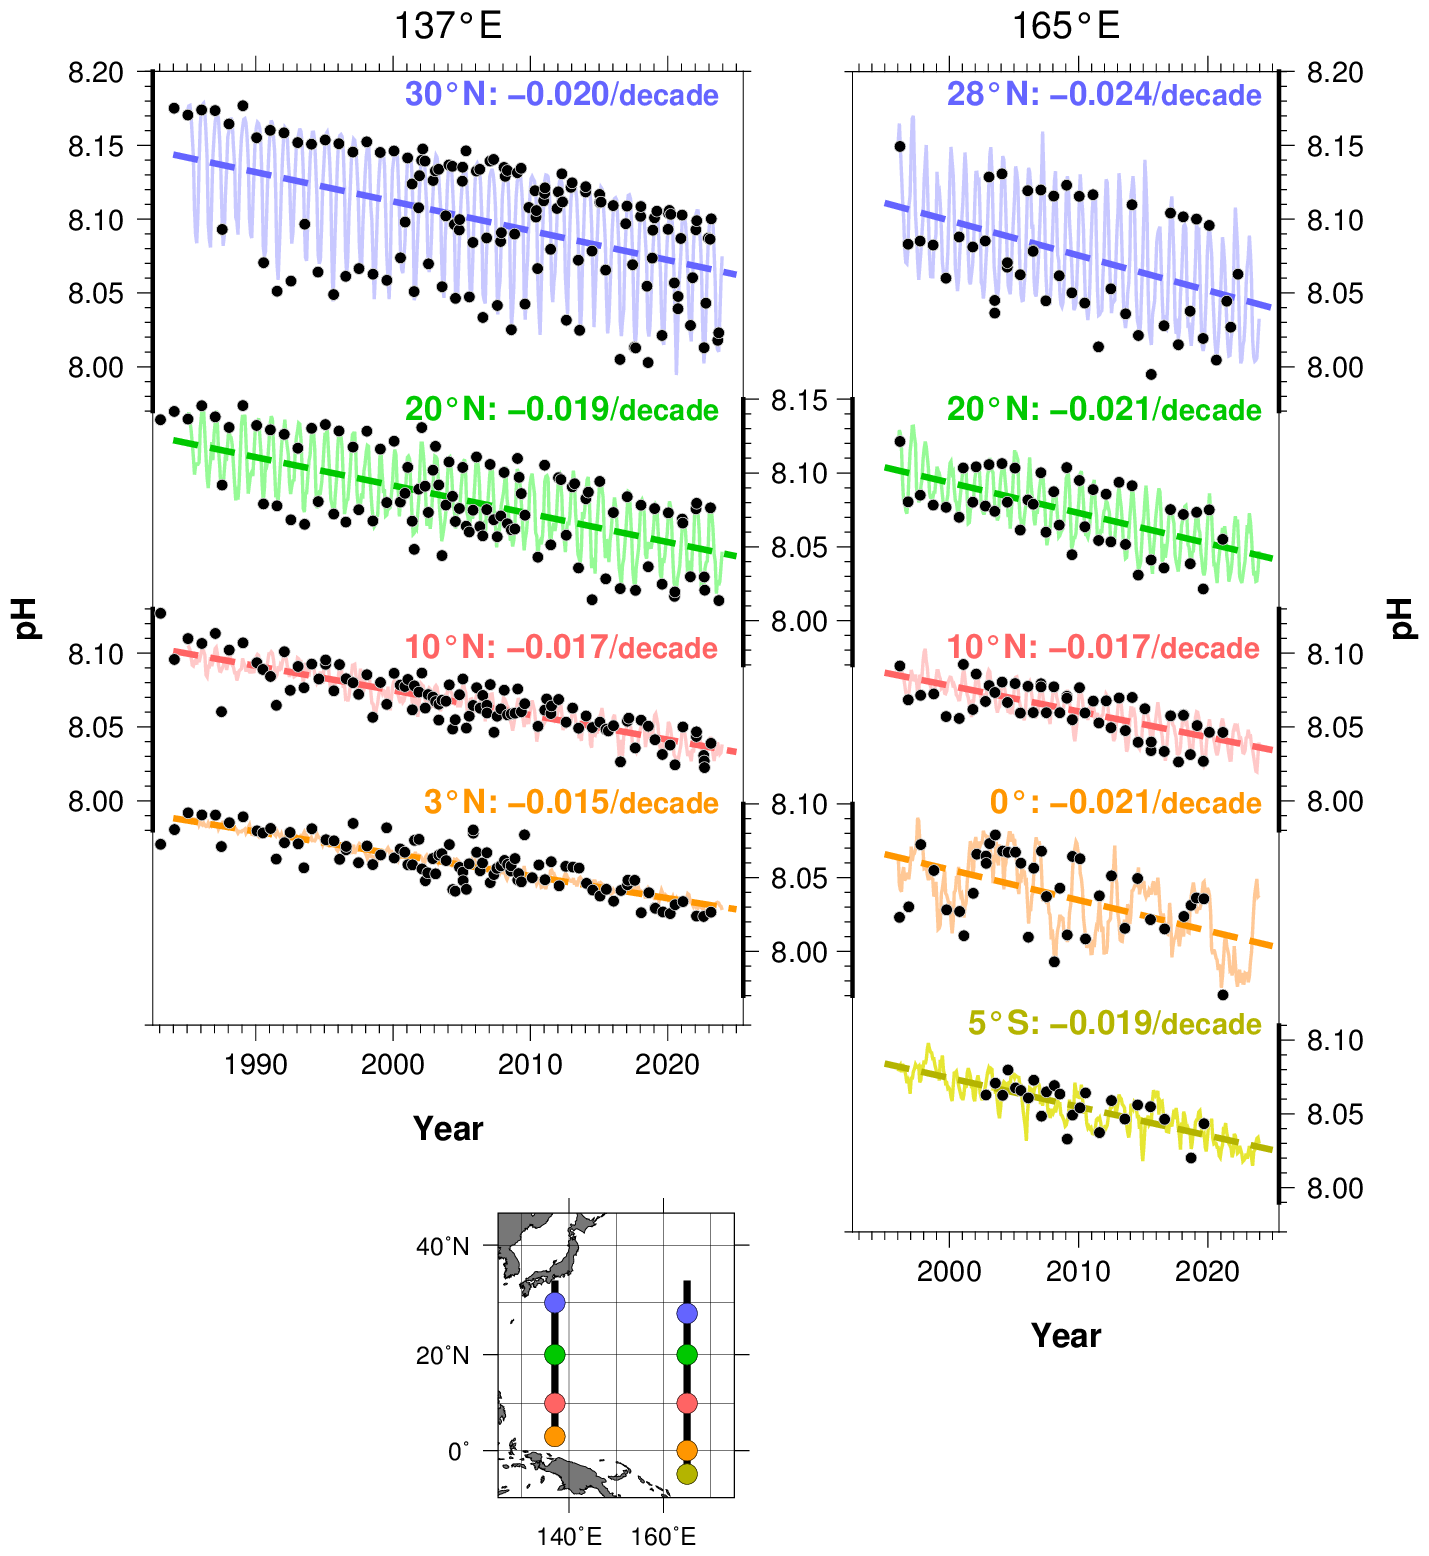
Long-term trends of pH at each latitude in JMA’s repeat hydrographic lines at 137°E (left) and 165°E (right).
Black plots show pH observation values based on pCO2 observation data. Solid lines represent monthly pH values reconstructed using the method of Ishii et al. (2011), dashed lines show the long-term trend of pH, and numbers indicate rates of change at each latitude.
Oceans are the earth’s largest sinks for carbon dioxide (CO2) emitted as a result of human activity, and the chemical properties of surface seawater change due to anthropogenic CO2 uptake. Ocean acidification, which stems from reduced seawater pH (hydrogen ion exponent), is a particular issue of concern because it accelerates global warming by reducing the capacity of oceans to take in CO2 from the atmosphere and affects marine ecosystems by disturbing plankton growth. Numerical model experiments based on future CO2 emission estimates show an ocean surface pH decrease of 0.16–0.44 from the end of the 19th century to the end of the 21st century (IPCC, 2021).
To monitor the long-term variability of ocean-related changes such as global warming and ocean acidification, the Japan Meteorological Agency (JMA) has long conducted oceanographic observations in the western North Pacific. This work has included monitoring to highlight long-term trends of pH in surface seawater along JMA’s repeat hydrographic lines at 137°E since 1985 and 165°E since 1996 using data on CO2 concentration in surface seawater and related variables. The results show a clear trend of in-situ pH decrease at each latitude at a rate of 0.015–0.028 per decade.
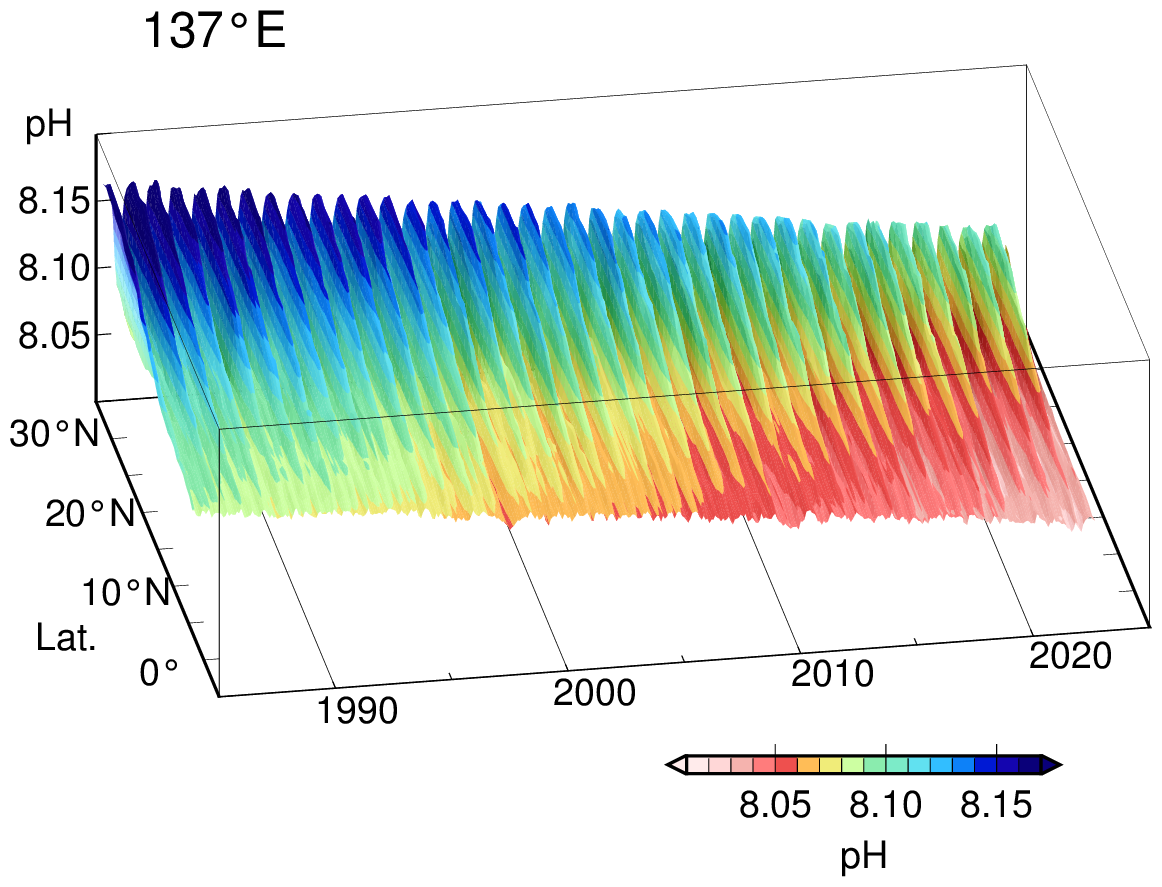
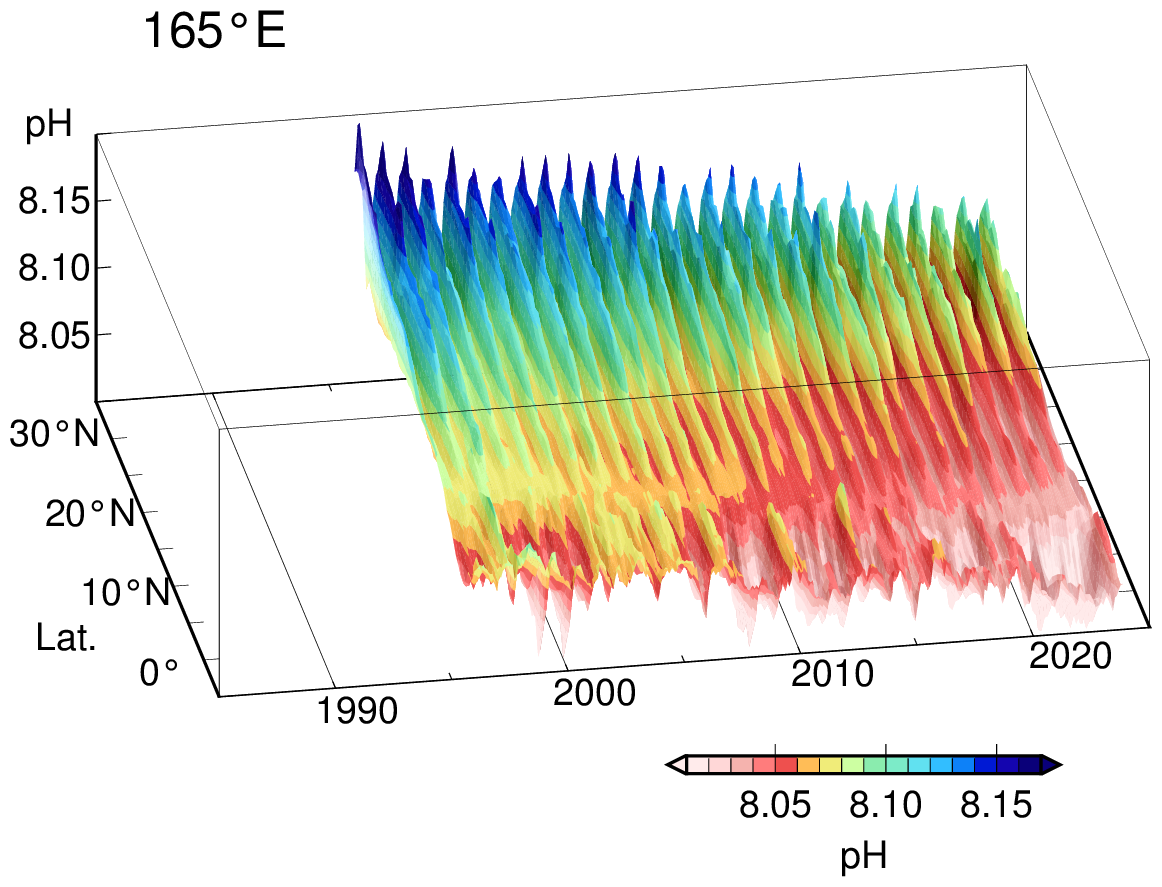
Time-latitude distribution of pH along the 137°E (left) and the 165°E (right) lines.
Colors indicate reconstructed monthly pH values.
The part on the left shows pH along 137°E (3°N–34°N) since 1985, and the part on the right shows pH along 165°E (5°S–35°N) since 1996.