Contents
- Imaging bands
- Spectral Response Functions
- Test results
- Observing area and its time interval
- Photographs
Imaging bands
Himawari-8 and Himawari-9 have a new payload called the Advanced Himawari Imager (AHI) for dedicated meteorological mission.
Table 1 shows the AHI observation bands. The functions and specifications are notably improved from those of the imagers on board MTSATs, and the AHI contributes to better nowcasting, improved numerical weather prediction accuracy and enhanced environmental monitoring. Color images are derived by compositing three visible band (blue: 0.47 µm; green: 0.51 µm; red: 0.64 µm).
* The Himawari-8/9 band corresponding to the MTSAT-1R/2 IR1 band was changed from 11.2 µm to 10.4 µm on 31 October, 2013.
| Wave length [µm] | Himawari-8/9 | MTSAT-1R/2 | |||||
|---|---|---|---|---|---|---|---|
| Band number | Spatial resolution at SSP [km] | Central wave length [µm] | Channel name | Spatial resolution at SSP [km] | |||
| AHI-8 (Himawari-8) | AHI-9 (Himawari-9) | ||||||
| 0.47 | 1 | 1 | 0.47063 | 0.47059 | - | - | |
| 0.51 | 2 | 1 | 0.51000 | 0.50993 | - | - | |
| 0.64 | 3 | 0.5 | 0.63914 | 0.63972 | VIS | 1 | |
| 0.86 | 4 | 1 | 0.85670 | 0.85668 | - | - | |
| 1.6 | 5 | 2 | 1.6101 | 1.6065 | - | - | |
| 2.3 | 6 | 2 | 2.2568 | 2.2570 | - | - | |
| 3.9 | 7 | 2 | 3.8853 | 3.8289 | IR4 | 4 | |
| 6.2 | 8 | 2 | 6.2429 | 6.2479 | IR3 | 4 | |
| 6.9 | 9 | 2 | 6.9410 | 6.9555 | - | - | |
| 7.3 | 10 | 2 | 7.3467 | 7.3437 | - | - | |
| 8.6 | 11 | 2 | 8.5926 | 8.5936 | - | - | |
| 9.6 | 12 | 2 | 9.6372 | 9.6274 | - | - | |
| 10.4 | 13 | 2 | 10.4073 | 10.4074 | IR1 | 4 | |
| 11.2 | 14 | 2 | 11.2395 | 11.2080 | - | - | |
| 12.4 | 15 | 2 | 12.3806 | 12.3648 | IR2 | 4 | |
| 13.3 | 16 | 2 | 13.2807 | 13.3107 | - | - | |
| SSP: sub satellite point | |||||||
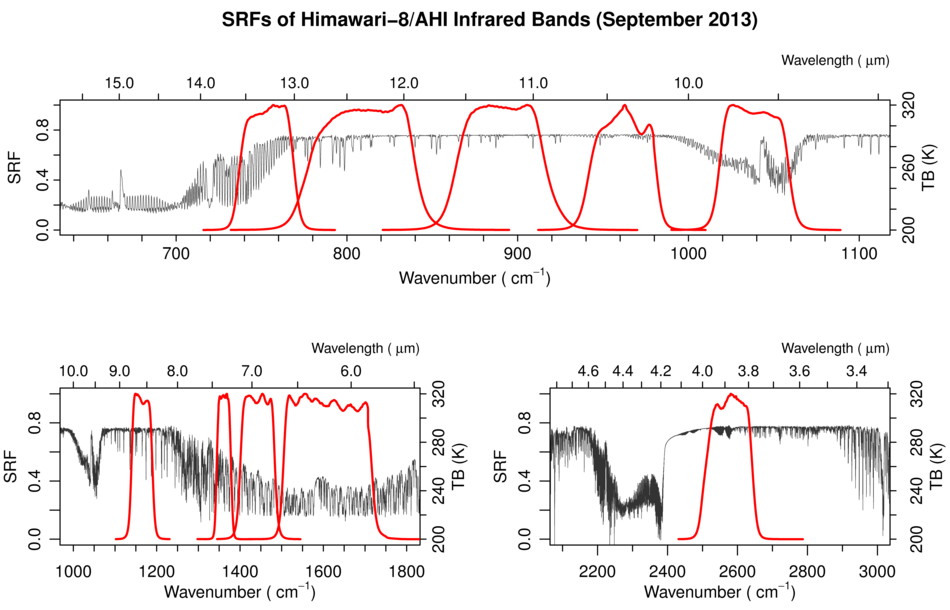
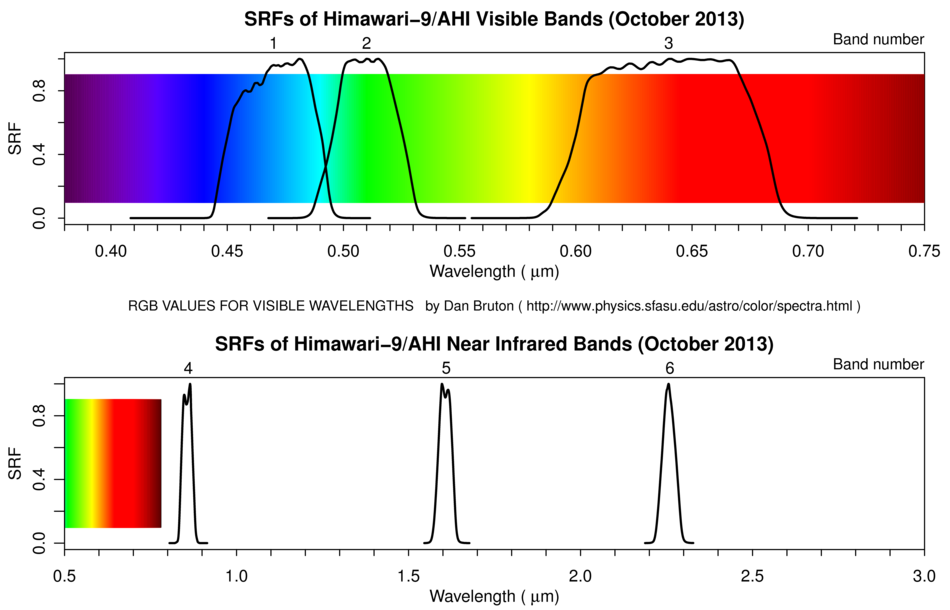
Spectral Response Functions
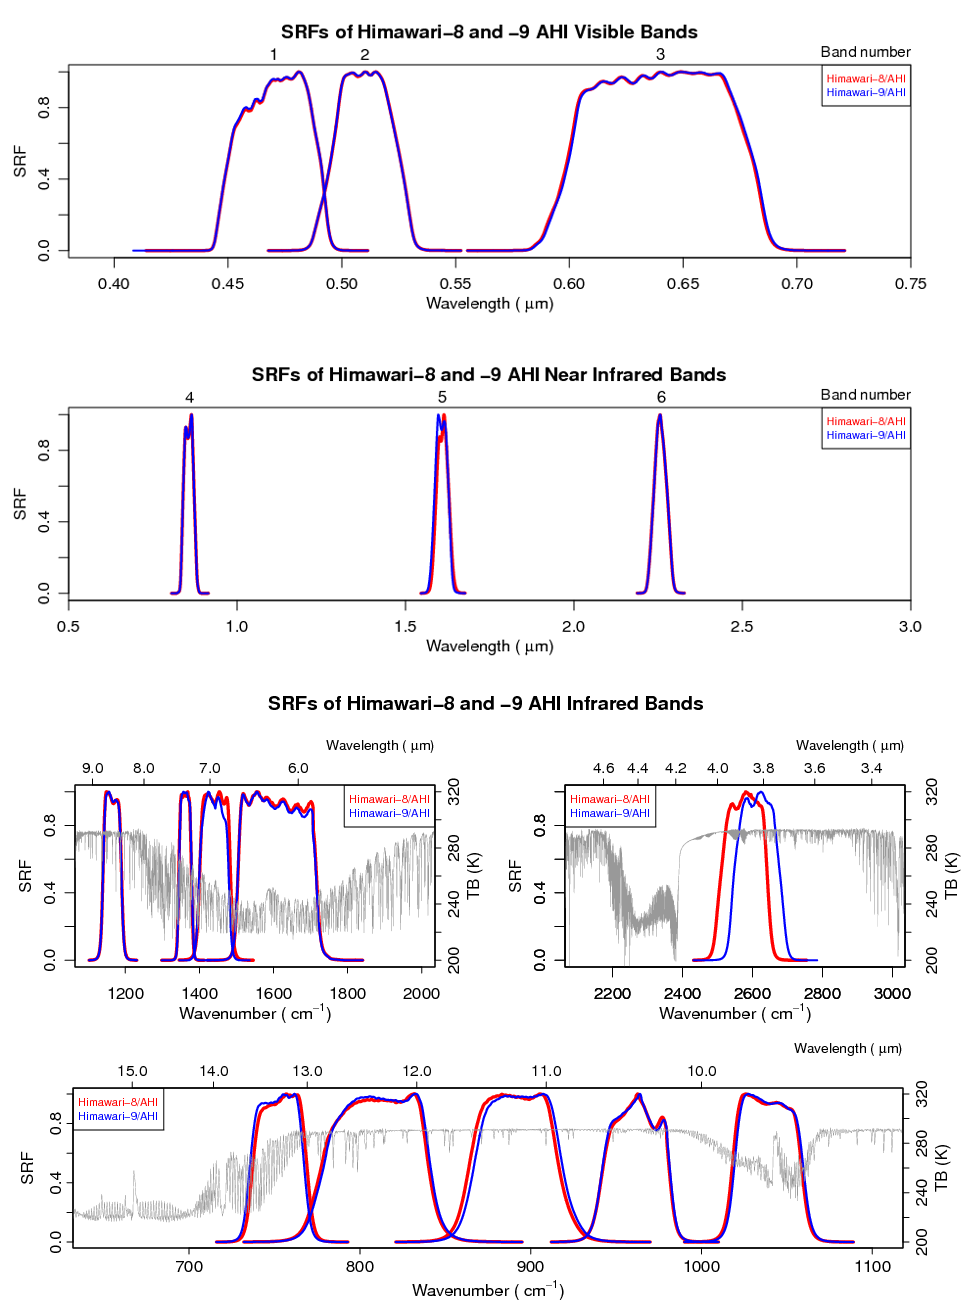
The figures below show the SRFs (Spectral Response Functions) of the AHIs on board Himawari-8 (as of September 2013) and -9 (as of October 2013). Microsoft Excel workbooks (zip files) of the SRFs for AHIs on Himawari-8 and -9 can also be downloaded from the hyperlinks below.


- Comparison of Spectral Response Functions between AHI-8 and -9 (PNG, 250 KB)
- AHI-8_SpectralResponsivity.zip (1.1 MB) (update September 2013; provided by ITT Exelis)
- AHI-9_SpectralResponsivity.zip (1.1 MB) (update October 2013; provided by ITT Exelis)
Test results
The performance of the AHI on board Himawari-8 is evaluated in ground testing. The test results, including data on the center wavelength, bandwidth, bits, SNR, dynamic range, radiometric calibration accuracy, internal calibration target (ICT) emissivity and out-of-band response, can be accessed via the following link:
Observation area and periodicity
Himawari-8 and -9 AHI scanning is conducted in the categories of Full Disk (whole-earth images), Japan Areas (Regions 1 and 2), Target Area (Region 3) and Landmark Areas (Regions 4 and 5). The Full Disk and Japan Area scan ranges are fixed, while those for Target Area and Landmark Area scanning are set in prompt response to changes in meteorological conditions.
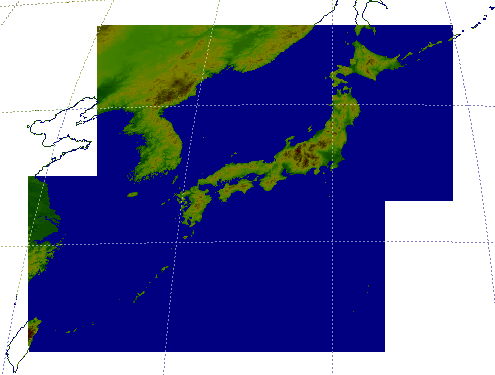
Landmark Area scanning data are used only for Himawari-8 navigation, and are not intended for use as satellite products. JMA plans to use Region 5 for observation of rapidly developing cumulonimbus cloud enabling provision of data to users. Each 10-minute period incorporates one Full Disk scan, four Japan Area and Target Area scans, and twenty scans for each Landmark Area. This 10-minute sequence is a basic unit of the observation schedule timeline. In Himawari-8 and -9 baseline observations, the timeline is repeated every 10 minutes except during housekeeping operation. Observation areas and frequencies are shown in Table 2, timeline-based scan images are shown in Figure 2, the Japan Area is shown in Figure 3, and observation areas/pixel numbers are shown in Table 3 (subject to in-orbit-test in regional observation).
The following animation shows the concept of the AHI observation sequence on a 10-minute timeline:
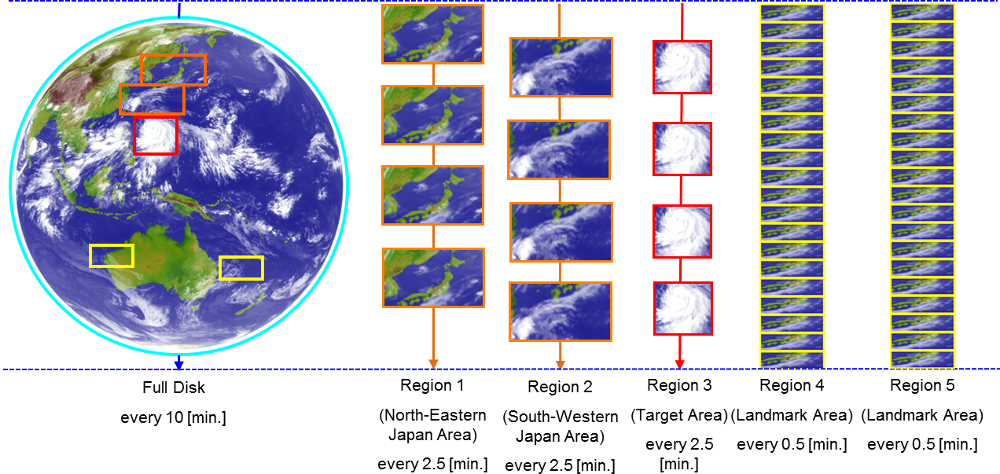
(Subject to slight changes based on the results of in-orbit testing after launch)
| Observations per timeline | Time cycle [min.] | Observations per day | |
|---|---|---|---|
| Full Disk (Fixed) | 1 | 10 | 144 |
| Japan Area (Fixed) (Region 1 + Region 2) |
4 | 2.5 | 576 |
| Target Area (Flexible) (Region 3) |
4 | 2.5 | 576 |
| Landmark Area (Flexible) (Region 4) |
20 | 0.5 | 2,880 |
| Landmark Area (Flexible) (Region 5) |
20 | 0.5 | 2,880 |
| Observation area | Band number (see Table 1) |
Spatial resolution at SSP (sub satellite point)[km] |
Numbers of pixels | |
|---|---|---|---|---|
| East-west direction | North-south direction | |||
| Full Disk | 3 | 0.5 | 22,000 | 22,000 |
| 1,2,4 | 1 | 11,000 | 11,000 | |
| 5-16 | 2 | 5,500 | 5,500 | |
| Japan Area (Region 1 + Region 2) |
3 | 0.5 | 6,000 | 4,800 |
| 1,2,4 | 1 | 3,000 | 2,400 | |
| 5-16 | 2 | 1,500 | 1,200 | |
| Target Area (Region 3) |
3 | 0.5 | 2,000 | 2,000 |
| 1,2,4 | 1 | 1,000 | 1,000 | |
| 5-16 | 2 | 500 | 500 | |
| Landmark Area (Region 4) |
3 | 0.5 | 2,000 | 1,000 |
| 1,2,4 | 1 | 1,000 | 500 | |
| 5-16 | 2 | 500 | 250 | |
| Landmark Area (Region 5) |
3 | 0.5 | 2,000 | 1,000 |
| 1,2,4 | 1 | 1,000 | 500 | |
| 5-16 | 2 | 500 | 250 | |
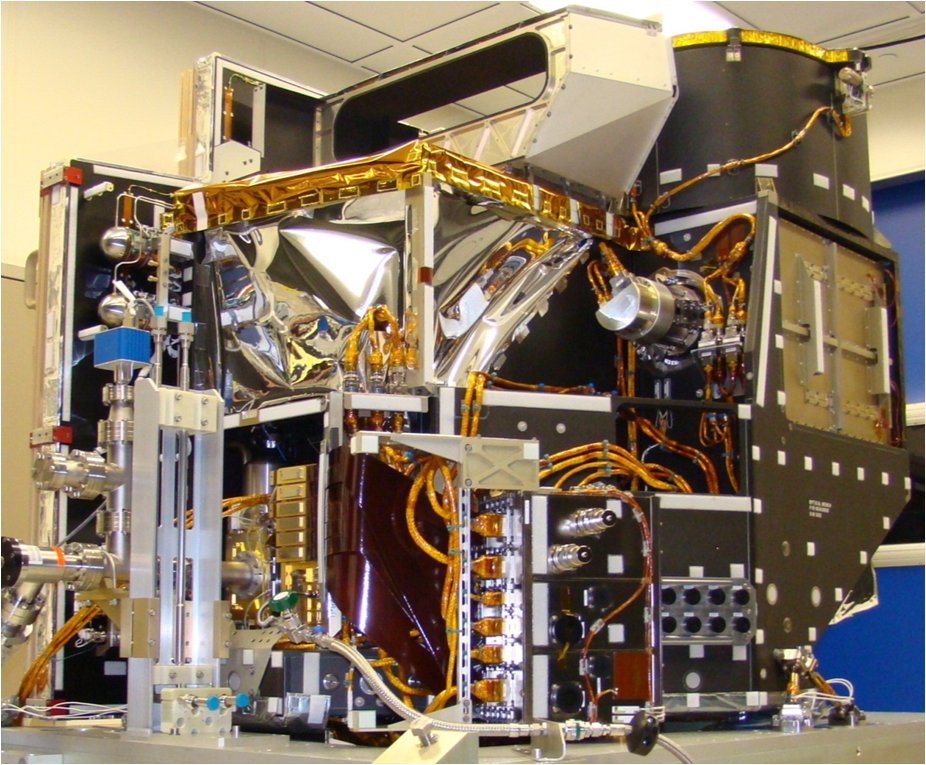
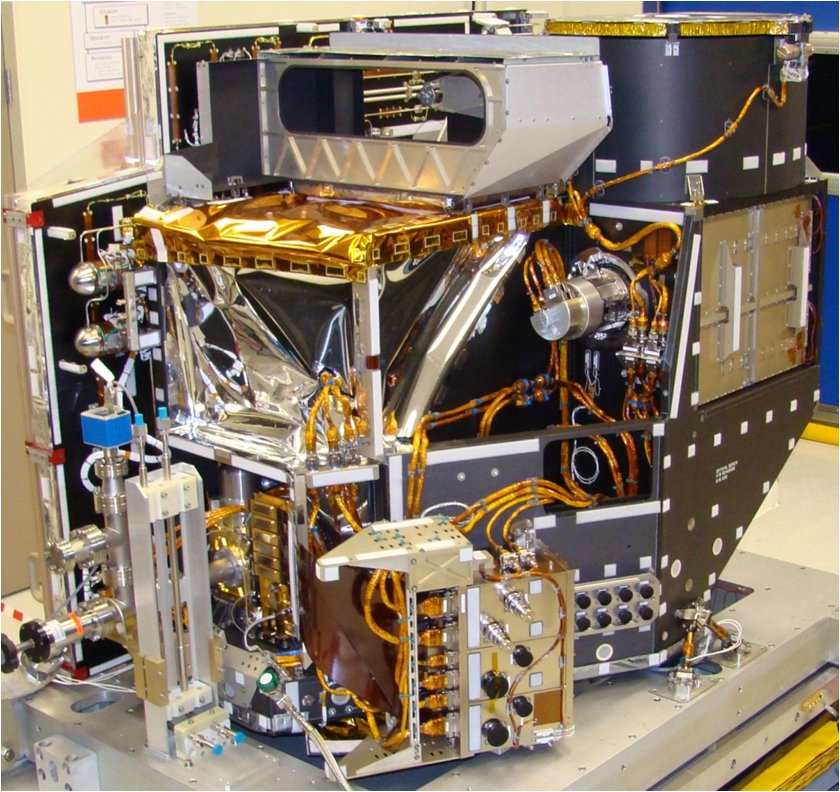
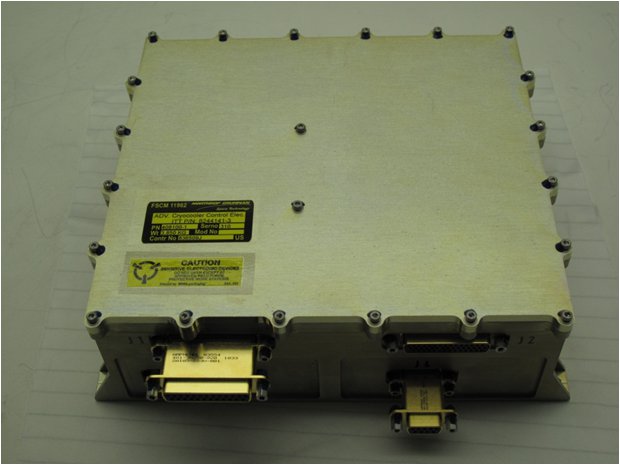
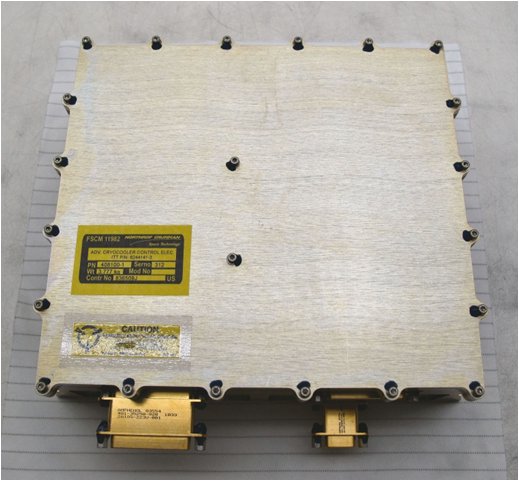
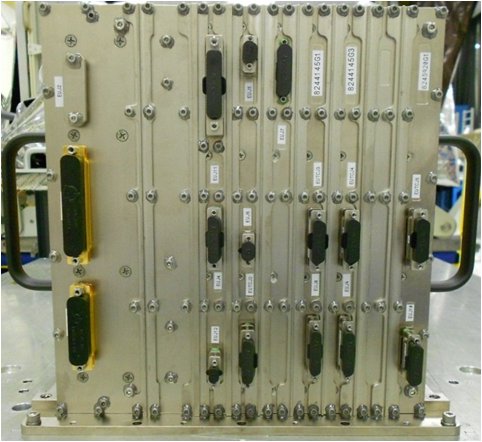
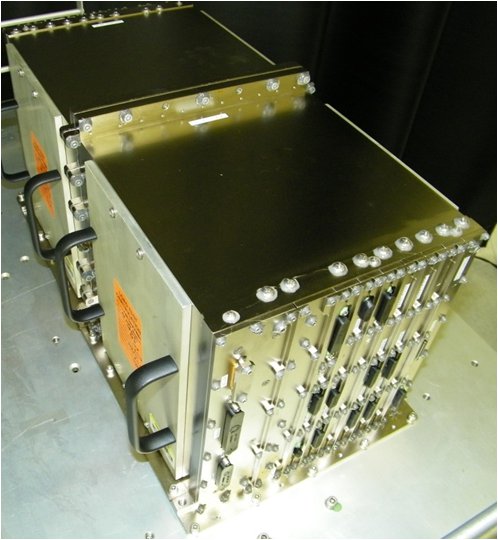
Photographs (Click figure to enlarge.)
The AHI unit to be installed on the Himawari-8 satellite is under manufacture. (Photos © ITT Exelis)