Purpose of proxy data disclosure
This page provides information on radiative transfer model-based AHI simulation. Simulation data have been made public for use in AHI research and development during the pre-launch phase, and the data listed on this page can be freely used for scientific purposes. It should be noted that the data format is different from that to be disseminated in Himawari-8/9 operation. JMA does not guarantee that the software to be used with the proxy data will work with real AHI data to be made available in the future.
Proxy data from simulation
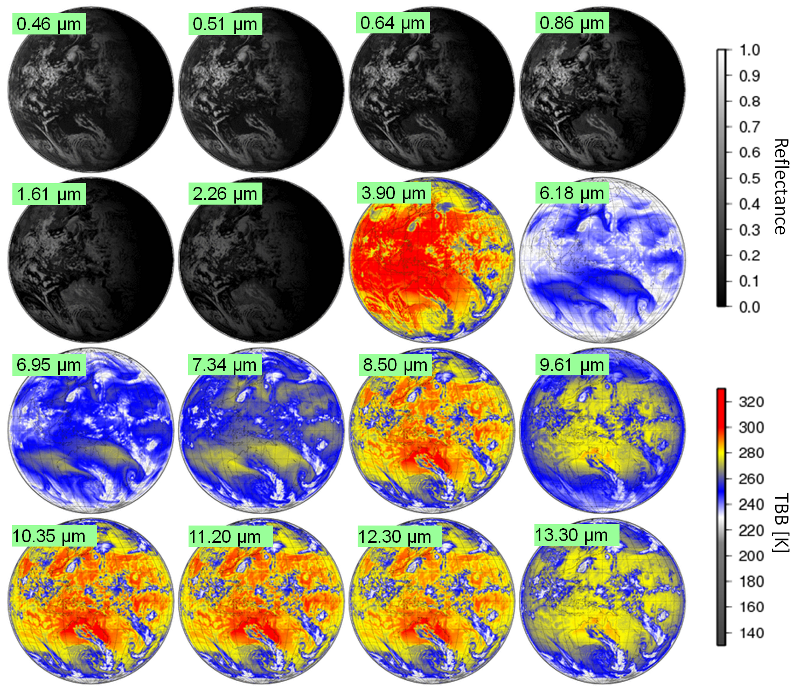
To support research and development for Himawari-8/9 analysis products, simulation-based proxy data have been created. Figure 1 shows an example of AHI 16-band simulation. These data are generated using radiative transfer computation based on the provisional response functions of AHI. For this purpose, data from RSTAR (Nakajima and Tanaka 1986) are used.
AHI simulation data
Table 1 lists the AHI simulation data available on this website.
| RTM | Input NWP |
Format | Time | Area of coverage |
Spatial resolution |
# of bands |
Simulation data file |
|---|---|---|---|---|---|---|---|
| RSTAR | GSM (FT=0) |
NetCDF | 06UTC 28 Sept. 2012 | 60°S ≤ Lat. ≤ 60°N 80°E ≤ Lon. ≤ 200°E |
0.2° x 0.2° (601 x 601 pixels) |
16 | [Note] download (7.2MB) |
FT: forecast time (hours) from analysis. The addition of further simulation data is planned.
Radiative transfer calculation design
Table 2 shows RSTAR-based radiative transfer calculation design. Analysis and forecasts from JMA NWP (numerical weather prediction) are adopted as atmospheric fields. To determine surface conditions, a MODIS product provided by NASA is used. For atmospheric composition, climate conditions are currently adopted.
| Radiative transfer model | Longitude of sub-satellite point | SRF (Spectral Response Function) | # of vertical layers | Atmospheric profiles |
|---|---|---|---|---|
| Rstar6b (Nakajima and Tanaka 1986) | 140°E | Polygonal line expressed by five points | 14 | GSM (TL959L60, 20km horizontal resolution) |
| Surface | ||||
| Wind speed | GSM | |||
| Reflectance | MODIS Surface-Reflectance Product (MOD 09) | |||
| Optical depth | ||||
| Aerosol | Total-column climatology value used in the GSM | |||
| Cloud | Retrieved from GSM cloud liquid/ice water content (Ice crystal habits: hexagonal plates, Yang et al. 2000) |
|||
| Ozone | 3D Climatological ozone used in the GSM (Maki et al. 2008) | |||
Contact
- E-mait to : JMA/MSC webmaster
-

Acknowledgements
JMA is grateful to the staff of the OpenCLASTR project for providing the Rstar6b package used in this work. Thanks also go to Dr. T. Nakajima, Dr. H. Takenaka and S. Fukuda for their valuable comments on our radiance simulation, and to Dr. M. Sekiguchi for preparing non-spherical ice particle scattering kernels for Rstar6b.
References
- JMA, 2007: ′Outline of the operational numerical weather prediction at the Japan Meteorological Agency′. Appendix to WMO Numerical Weather Prediction Progress Report. Japan Meteorological Agency, Tokyo, Japan. Available at http://www.jma.go.jp/jma/jma-eng/jma-center/nwp/nwp-top.htm.
- Maki, T., A. Ebita, T. Ishimizu, K. Nagata, M. Ikegami and T. Sasaki, 2008: The Daily 3D Ozone Produced by the Chemical Transport Model for JRA-25. Extended abstracts of Workshop on the Third WCRP Reanalysis Conference, Tokyo, Japan, 28 January - 1 February, 2008.
- Nakajima, T. and M. Tanaka, 1986: Matrix formulation for the transfer of solar radiation in a plane-parallel scattering atmosphere. J. Quant. Spectrosc. Radiat. Transfer, 35, 13-21.
- Yang, P., K. N. Liou, K. Wyser and D. Mitchell, 2000: Parameterization of the scattering and absorption properties of individual ice crystals. J. Geophys. Res., 105, D4, 4699-4718.