Topics
Minimum in record of total ozone at Syowa Station, Antarctica
|
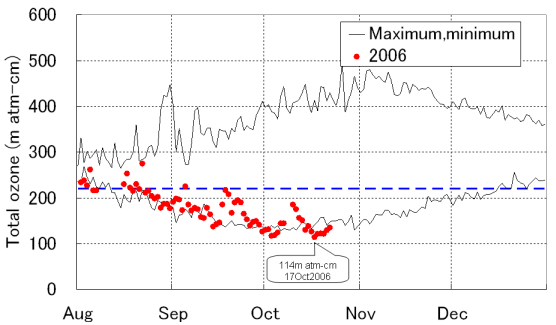
In 2006, the Antarctic ozone hole was developed to the maximum level in record,
and total ozone observed at Syowa Station, Antarctica, was the minimum in record.
|
1. Situation of Antarctic ozone hole in 2006
According to the observation conducted by the 47th Japanese Antarctic Research Expedition
(JARE-47) at Syowa Station in the Antarctica, the total ozone above the station broke the record of
128 m atm-cm on 6 October 1995, and reached its minimum in record of 114 m atm-cm on 17 October 2006,
which is less than half the average before 1980 when the ozone hole didn't appear yet
(Figure 1).
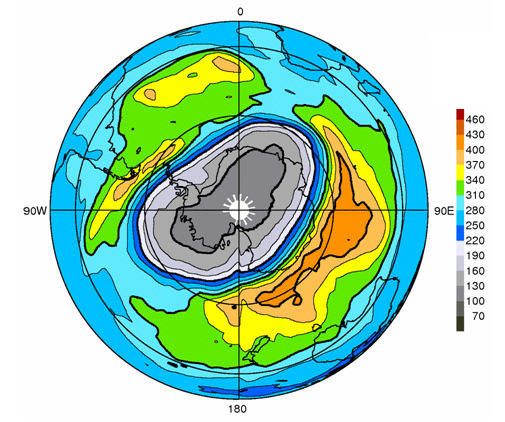
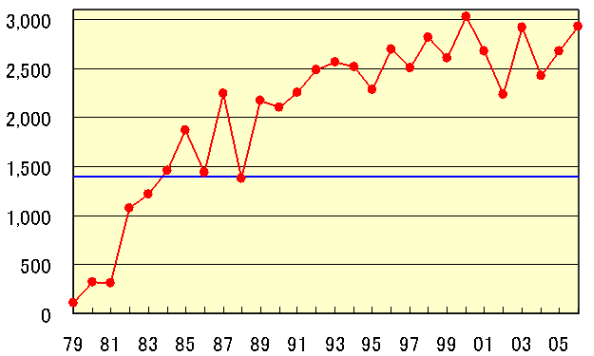
According to the satellite observation by the NASA, the Antarctic ozone hole in the stratospheric
ozone layer, defined as the area of the total ozone of 220 m atm-cm or below, developed
to its maximum level as follows
(Figure 2 and Figure 3):
|
Area: |
29.3 million km2 |
the second largest, only next to 2000 |
|
Deficit: |
105 million tons |
the second largest, only next to 2003 |
2. Reasons for this development of the Antarctic ozone hole
The establishment of the Antarctic ozone hole is attributable mainly to ozone depleting
substances and meteorological conditions. While the density of the ozone depleting
substances has remained high after its peak of the latter half of the 1990s, in 2006
the low temperature area of -78 °C or below, which is associated with
the degradation of the ozone depletion, kept varying around the maximum level of the
last 10 years. Therefore, it is thought that the ozone hole developed to the maximum level.
(Toru SASAKI, Ozone Layer Monitoring Office)
|
|
Figure 1 Annual variation in total ozone at Syowa Station in the Antarctica (until 22 October).
Black lines show daily maximum and minimum values since 1961. The horizontal blue dash line indicates 220 m atm-cm.
|
go to the body
|
|
Figure 2 Total ozone distribution in the Southern Hemisphere on 29 September 2006.
The ozone hole, defined as the area of the total ozone of 220 m atm-cm or below, covered
almost the whole Antarctica.
The blank area around the pole indicates the area where it was impossible to observe due to no sunlight reaching.
This chart is derived by JMA from the satellite observation data provided by the NASA.
|
go to the body
|
|
Figure 3 Time series of annual maximum area of the Antarctic ozone hole.
This figure shows the evolution of the ozone hole, defined as the area of the total ozone
of 220 m atm-cm or below, since 1979.
Blue line indicates the Antarctic area of about 14 million km2.
The left axis is in ten thousands km2.
This chart is derived by JMA from the satellite observation data provided by the NASA.
|
go to the body
Last updated : 26 October 2006 ©Copyright 2006, Japan Meteorological Agency