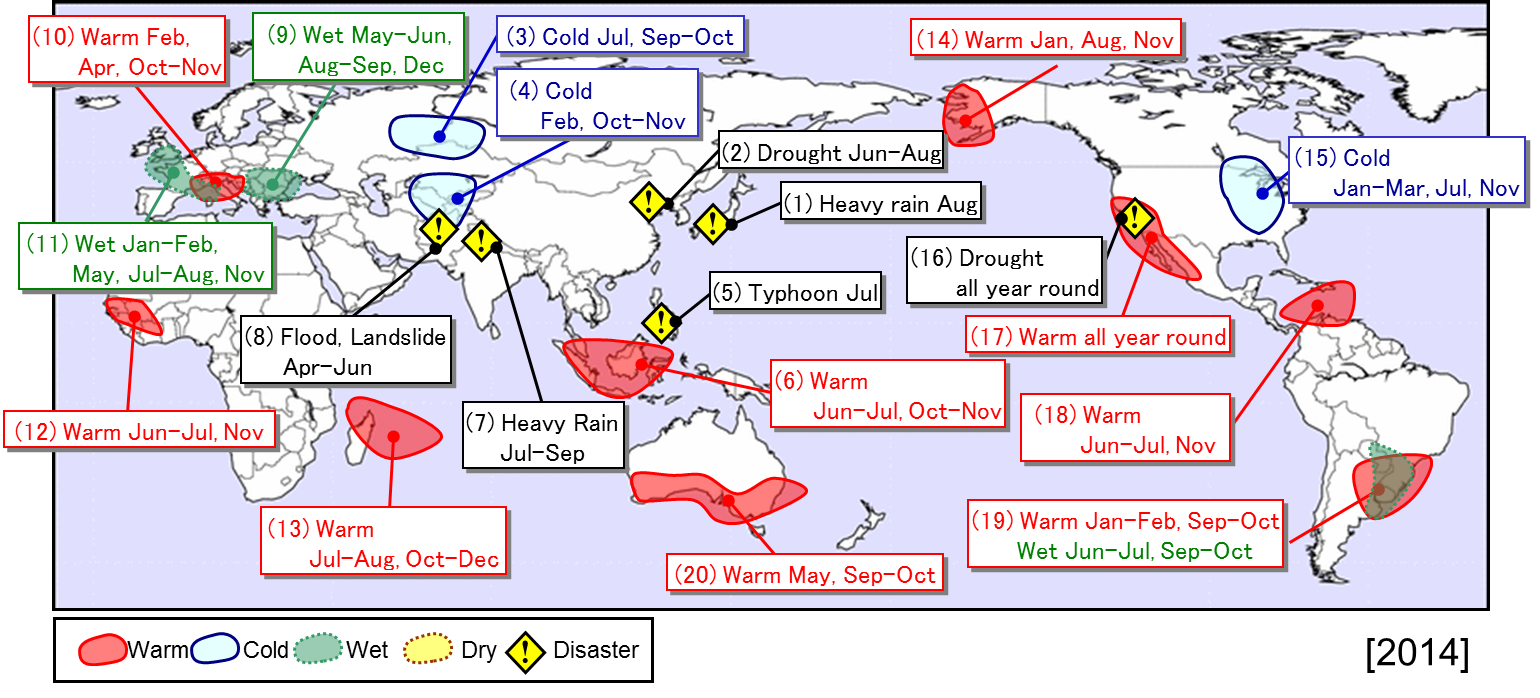
Major extreme climate events and weather-related disasters during this year
Highlight
Annual mean temperatures were above normal in many parts of the world, and were below normal in the Philippines, from Western Siberia to Central Asia and from central Canada to the southern USA. Extremely high temperatures were frequently observed from Malaysia to Indonesia, in southern Europe, western Africa, around northern Madagascar, in western Alaska, from the southwestern USA to northwestern Mexico, around the Caribbean Sea, around southern Brazil and in southern Australia, and extremely low temperatures were frequently observed in the southern part of Western Siberia, the southern part of Central Asia and around the Midwest of the USA.
Annual precipitation amounts were above normal from Central Siberia to the eastern part of Central Asia, in the southern Scandinavia Peninsula, southeastern Europe, around the Red Sea, in the northeastern USA, western Mexico, the southern part of South America and from Micronesia to the southern Philippines, and were below normal in the southern Arabian Peninsula and southern Algeria. Extremely heavy precipitation amounts were frequently observed in southeastern and western Europe and around southern Brazil.
Type
Period
Area
Remarks
1
Torrential Rain
August
Japan
2
Drought
June - August
Northeastern and eastern China
3
Low Temperature
July, September - October
The southern part of Western Siberia
4
High Temperature
February, October - November
The southern part of Central Asia
5
Typhoon
July
The Philippines
6
High Temperature
June - July, October - November
From Malaysia to Indonesia
7
Torrential Rain
July - September
India, Nepal and Pakistan
8
Floods and Landslides
April - June
Northern Afghanistan
9
Heavy Precipitation
May - June, August - September, December
Southeastern Europe
10
High Temperature
February, April, October - November
Southern Europe
11
Heavy Precipitation
January - February, May, July - August, November
Western Europe
12
High Temperature
June - July, November
Western Africa
13
High Temperature
July - August, October - December
In and around northern Madagascar
14
High Temperature
January, August, November
Western Alaska
15
Low Temperature
January - March, July, November
In and around the Midwest of the USA
16
Drought
All Year Round
California
17
High Temperature
All Year Round
From the southwestern USA to northwestern Mexico
18
High Temperature
June - July, November
Around the Caribbean Sea
19
High Temperature · Heavy Precipitation
January - February, September - October (for High Temperature) June -July, September - October (for Heavy Precipitation)
In and around southern Brazil
20
High Temperature
May, September - October
Southern Australia
This report and figure are based on climatological normals defined as 30-year mean from 1981 through 2010.
The impacts of each disaster are based on EM-DAT and reports by United Nations organizations and each government.
EM-DAT: The Emergency Events Database - Université catholique de Louvain (UCL) - CRED, D. Guha-Sapir - www.emdat.be, Brussels, Belgium.