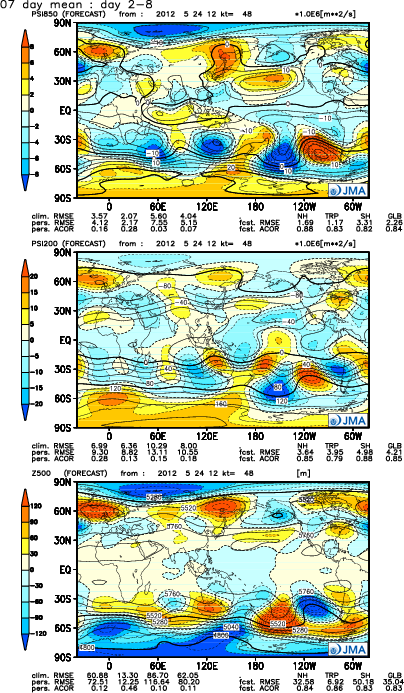
forecast period
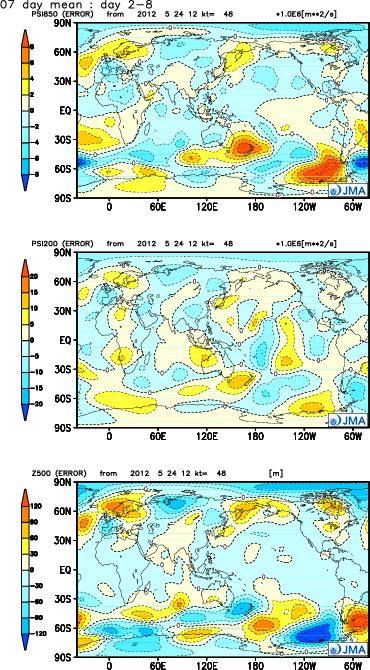
initial date
element
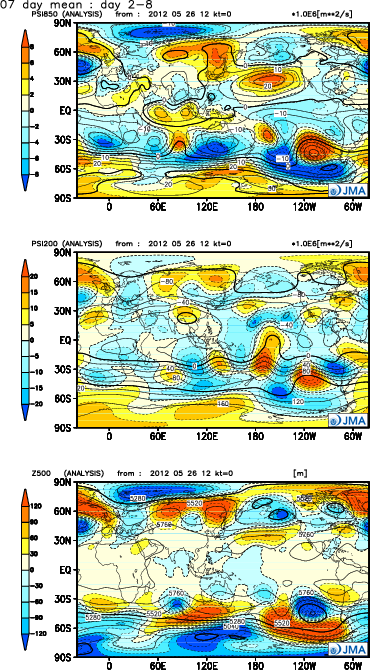
stream function
velocity potential
Z500,T850,PSEA
850hPa(top)
200hPa(middle)
precipitation(bottom)
(Shaded patterns show anomalies in left and middle figures, and that show errors in right figures.)
[Contour interval]
PSI850 : 5x1.0E6m2/s
PSI200 : 20x1.0E6m2/s
Z500 : 120m
CHI850 : 2x1.0E6m2/s
CHI200 : 2x1.0E6m2/s
PRECIP(RAIN) : 4mm/day
Z500 : 120m
T850 : 4C
PSEA : 4hPa
kt : lead time(hour)
ACOR : anomally correration
RMSE : root mean square error
fcst : ensemble mean forecast
clim : climate forecast
pers : persistency forecast
NH : 20N-90N
TRP : 20N-20S
SH : 20S-90S
GLB : 90N-90S
|
analysis
|
ensemble forecast
|
error of the forecast
|