This page describes the characteristics of CO2 mole fractions for the surface, upper air and column average with focus on global and hemispheric scales based on numerical simulation data used for Global CO2 Distribution.
The column-average CO2 mole fraction (XCO2) is the mole fraction of carbon dioxide molecules to dry air molecules in an air column per unit area from the surface to the top of the atmosphere. It represents the average atmospheric field of the whole earth, including upper air, and plays an important role in estimating the effects of future global warming and the earth's radiation budget. In related analysis, XCO2 is calculated using grid point data from 60 layers with σ-pressure hybrid coordinates from the carbon dioxide numerical model (GSAM-TM). For satellite observation and analysis results relating to atmospheric CO2 concentrations, refer to Ibuki Greenhouse gases Observing SATellite (GOSAT), National Institute for Environmental Studies (NIES) (external link).

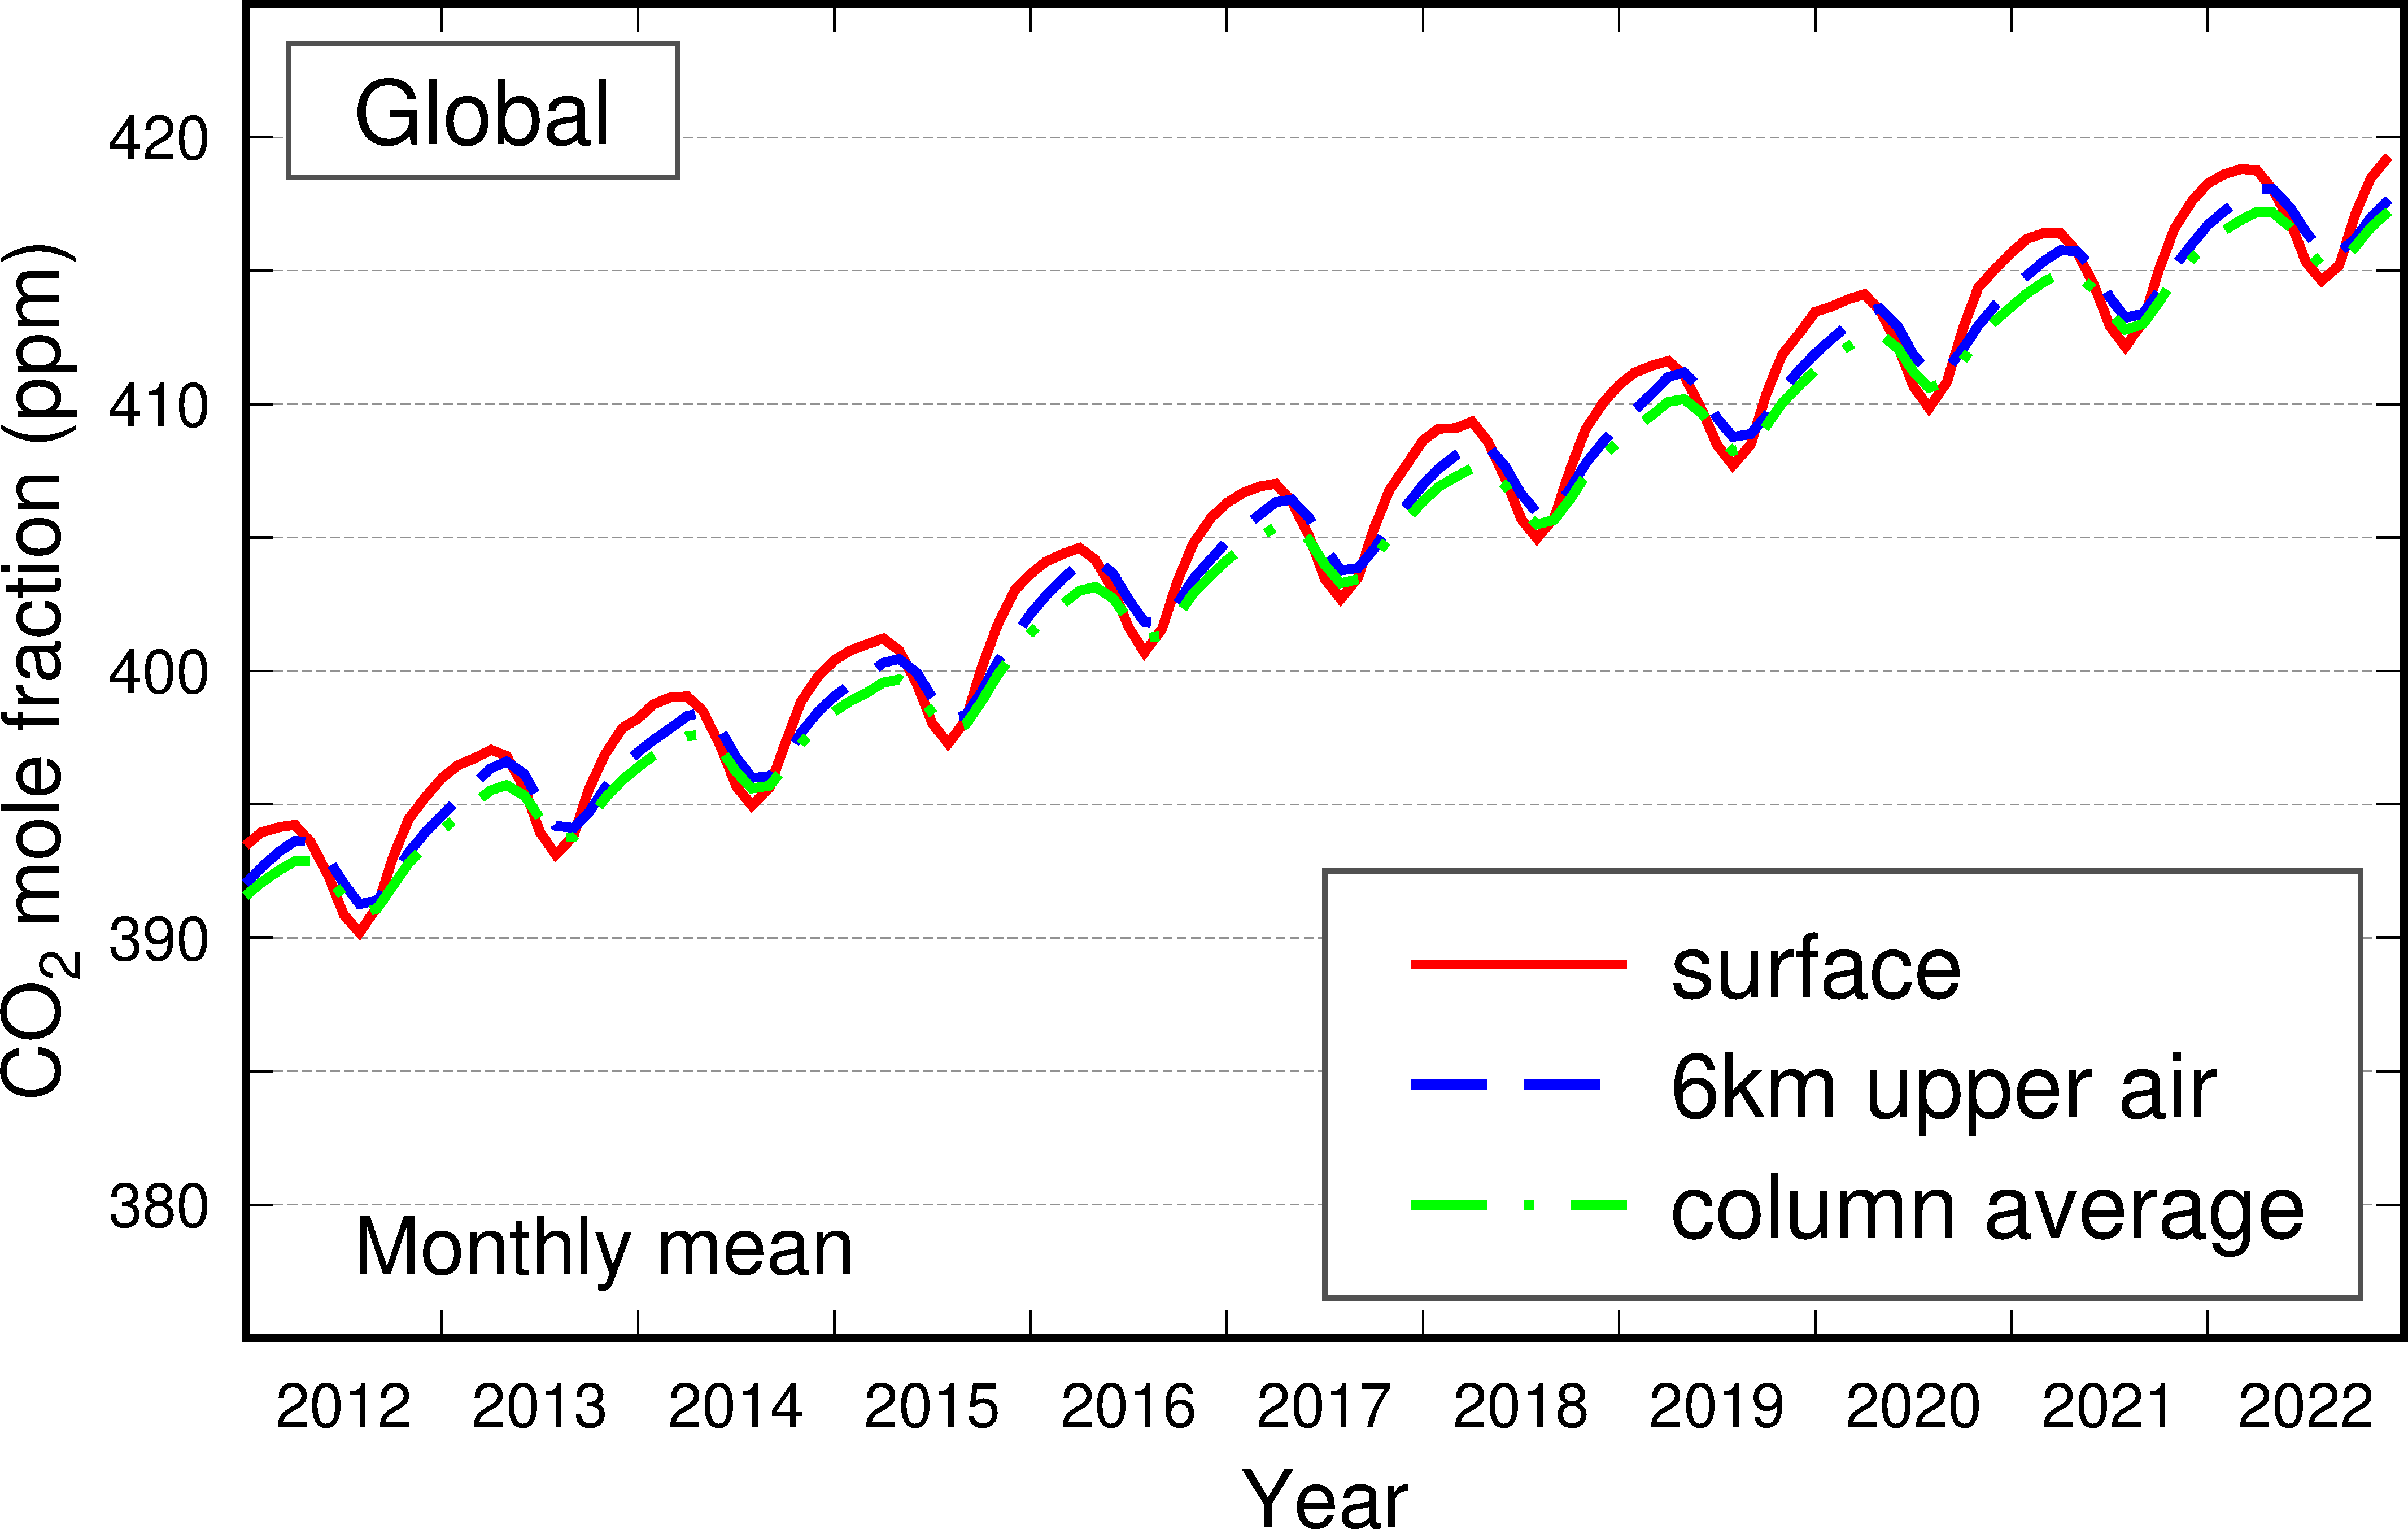
Figure 1. Global averages of annual (left) and monthly (right) mean CO2 mole fractions for the surface (red), upper air (blue) and column average (green). The figure is based on simulation data used for Global CO2 Distribution.
The panel on the left of Figure 1 shows global average annual mean CO2 mole fractions for the surface (red), the upper air at a height of around 6 km (blue) and the column average (green). The continuous increase observed is primarily attributed to human activities such as fossil-fuel combustion, which causes CO2 emissions exceeding the amount absorbed by plants and oceans. As the excess is widely spread laterally and vertically via atmospheric transport, CO2 mole fractions in the upper air increase while remaining slightly lower than those on the surface.
The panel on the right of Figure 1 shows corresponding monthly mean mole fractions. Surface, upper-air and column-average values are smaller in boreal summer and larger from winter to spring in close relation to plant and microbial activity. Active plant photosynthesis results in massive CO2 consumption in summer, while plant respiration and organic-matter decomposition in soil become dominant in winter. Due to vertical transport of CO2, surface variations are reflected in upper-air and column-average values with a smaller amplitude of variation. In addition, the time taken for this transport makes the yearly maximum of mole fractions appear later in the upper air and for the column average than on the surface.
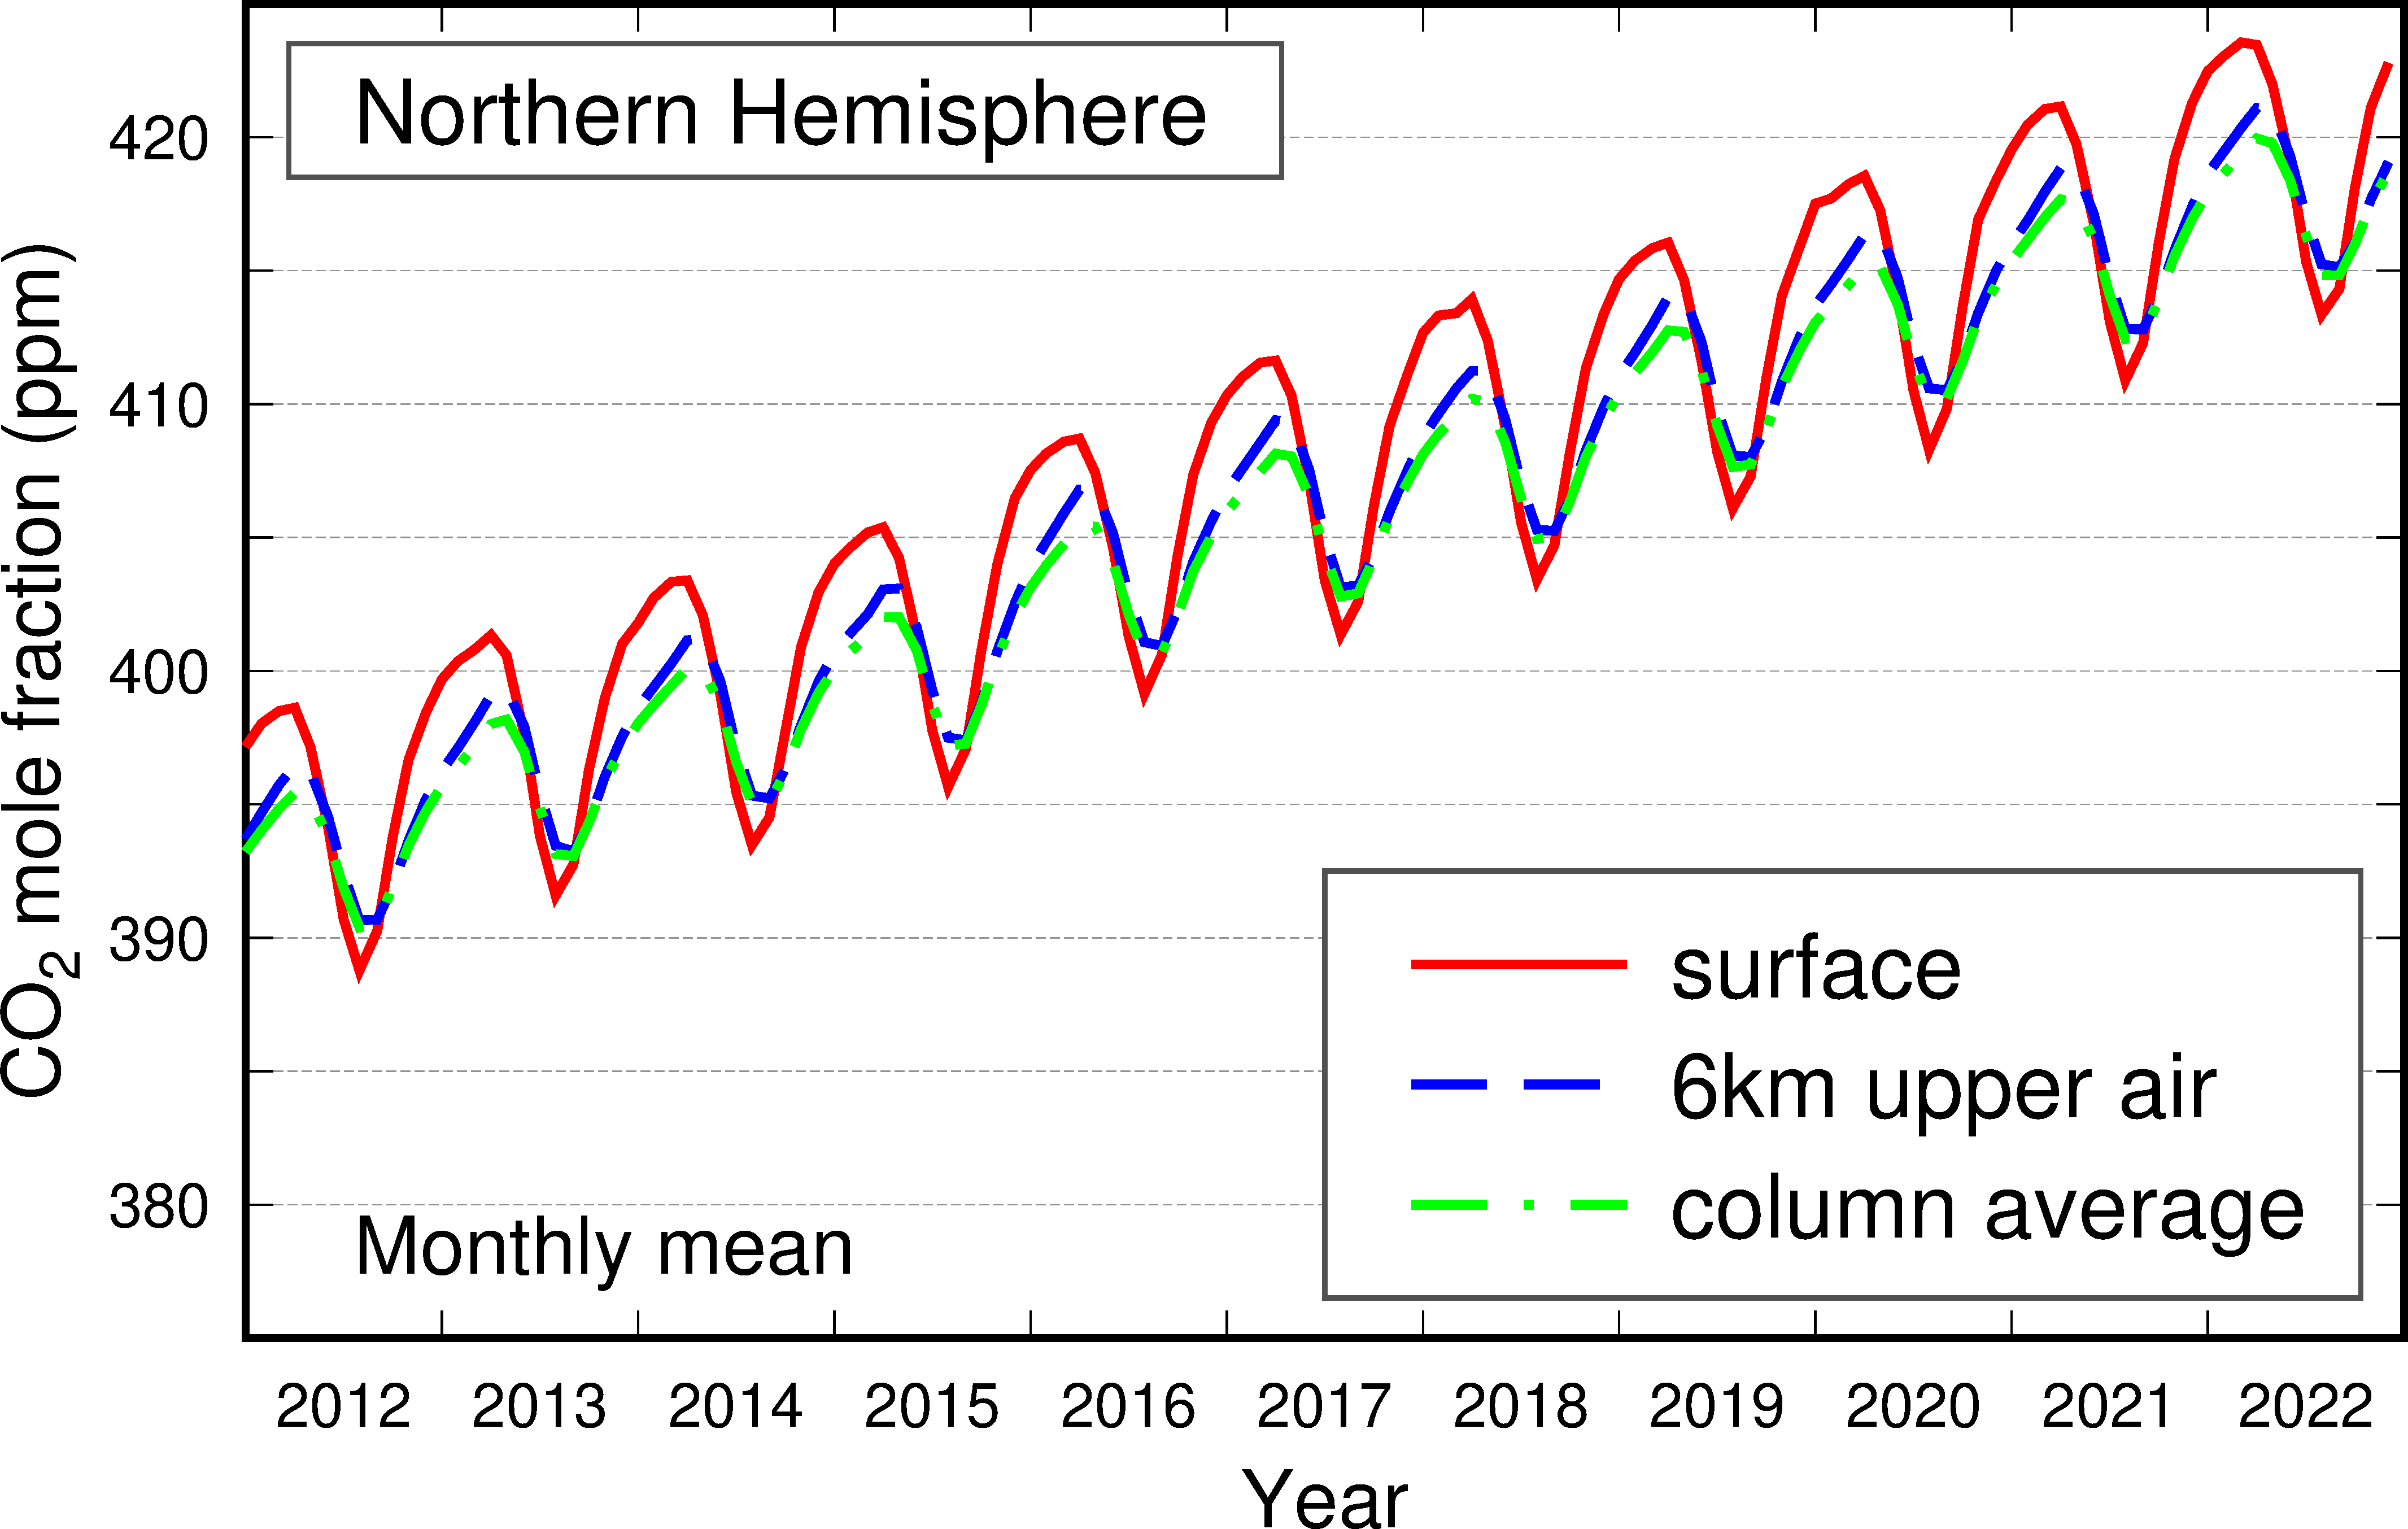
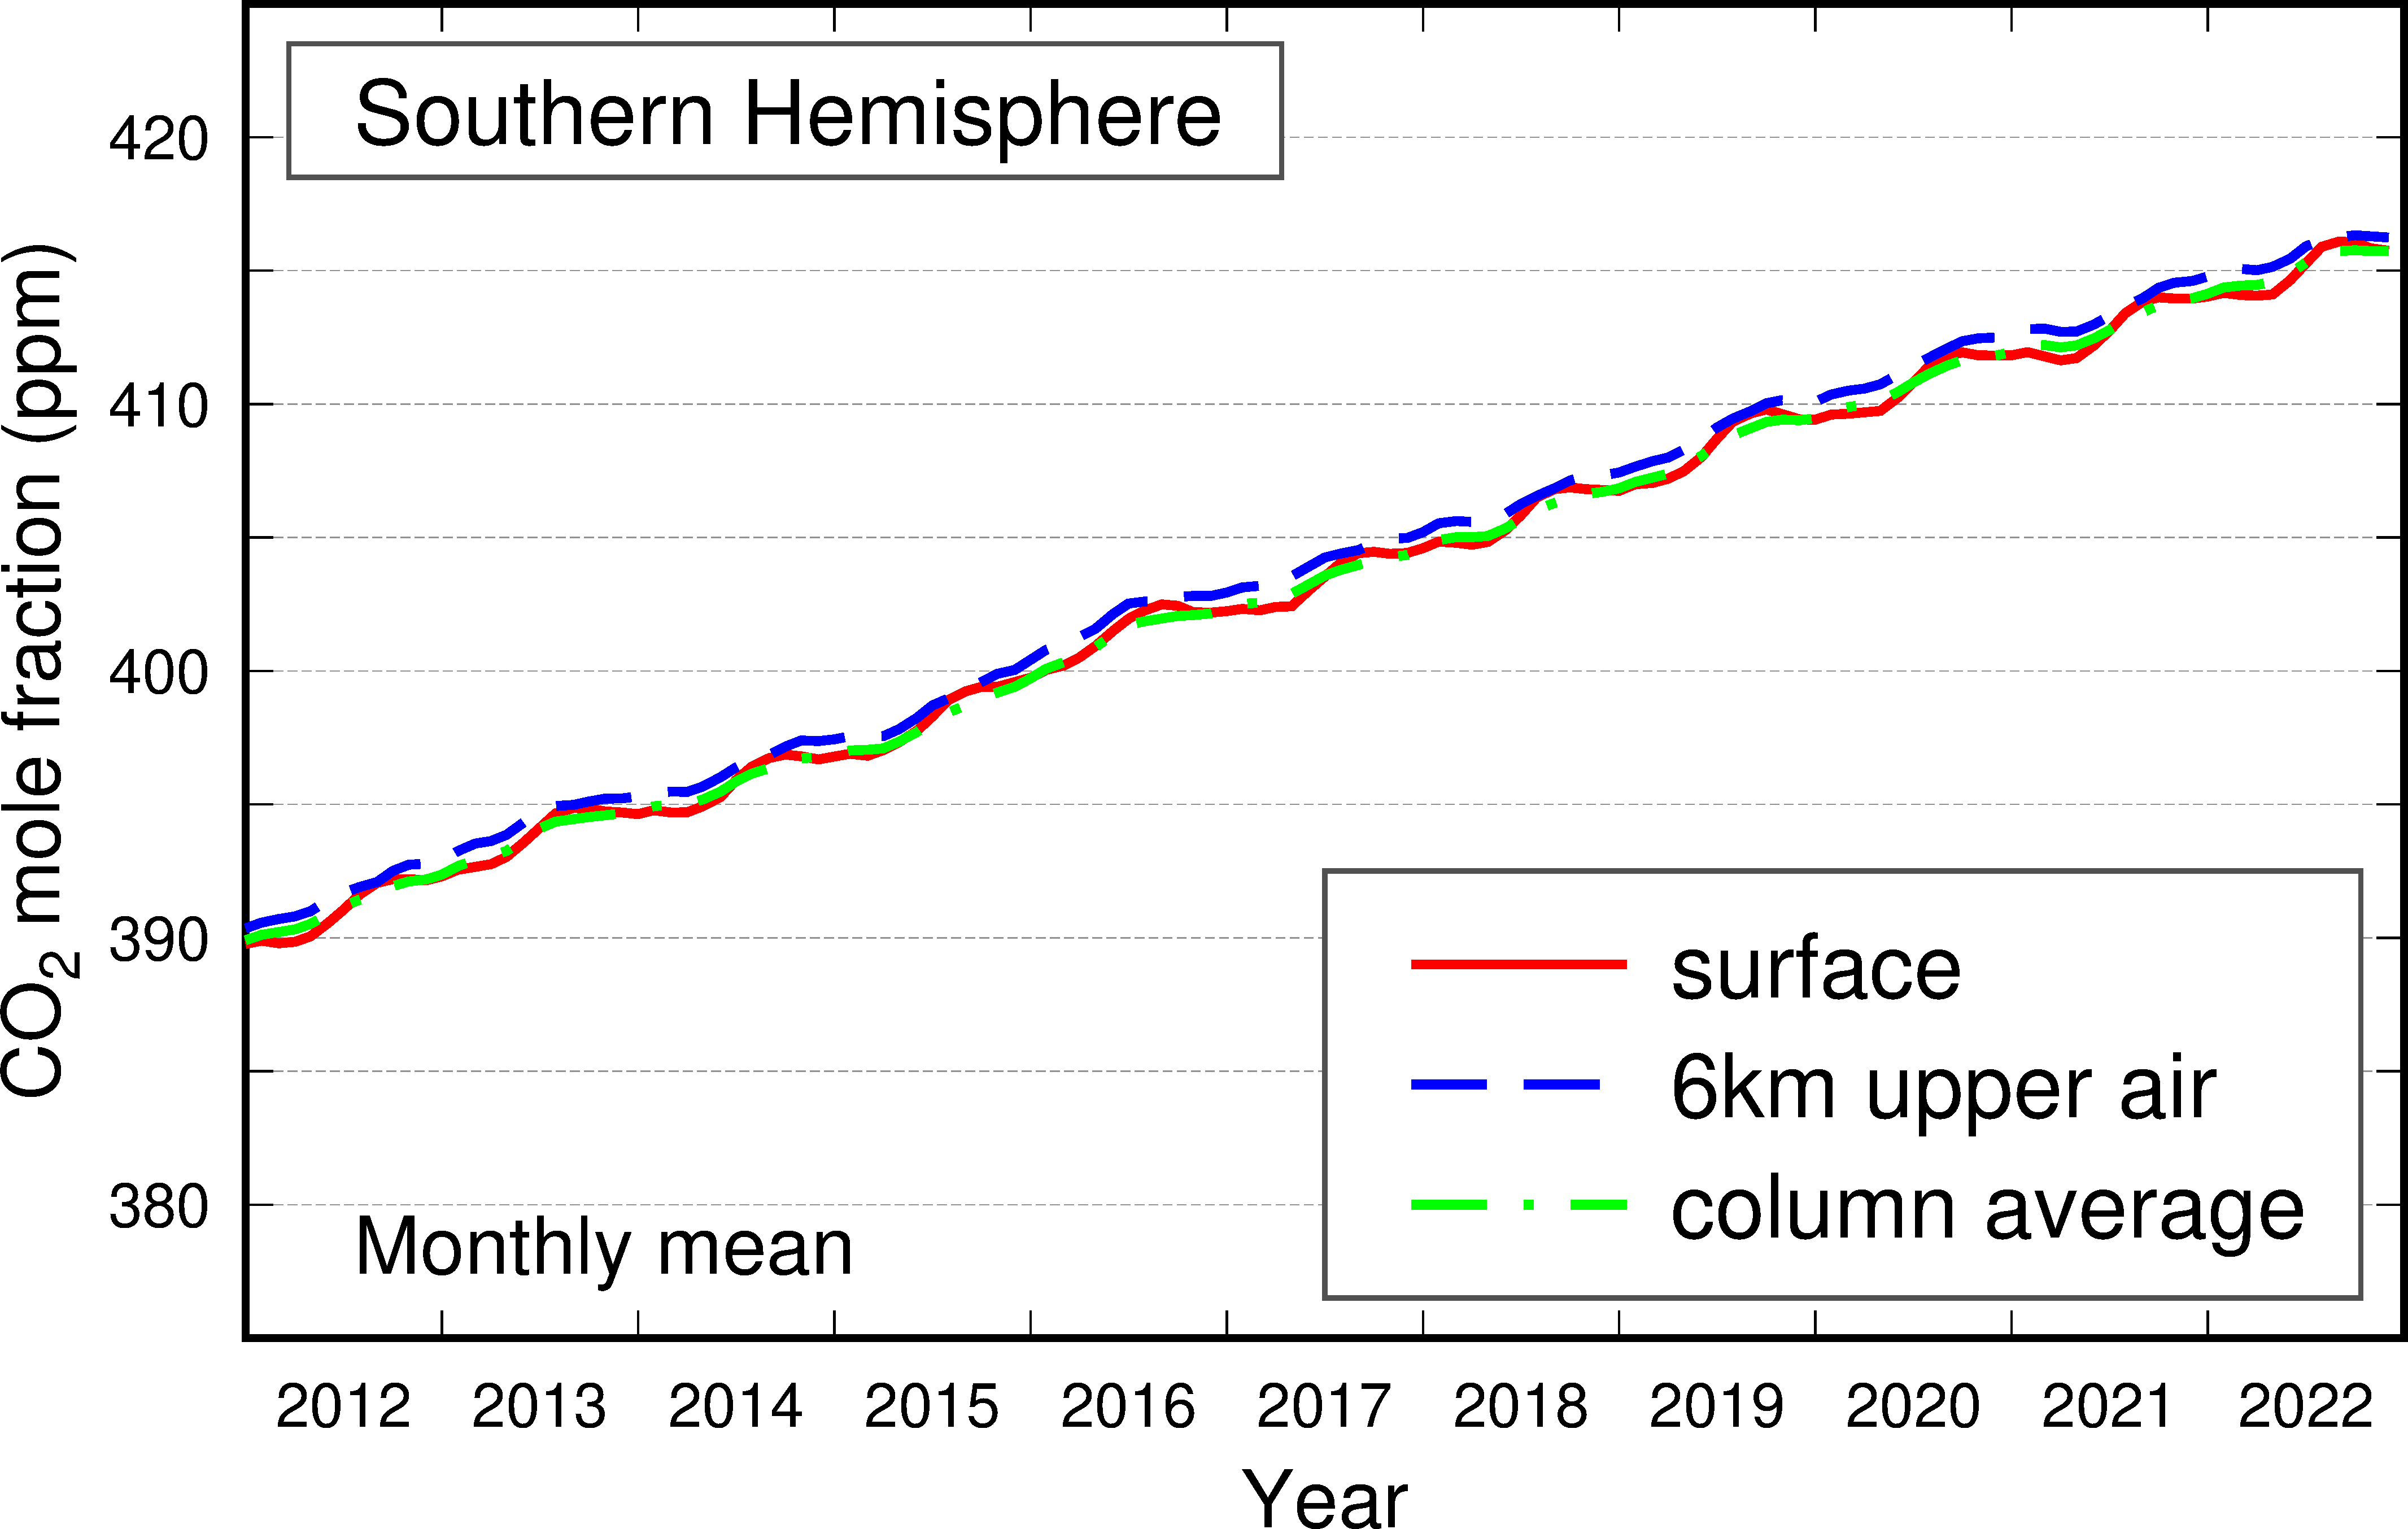
Figure 2. Monthly mean CO2 mole fractions for the surface (red), upper air (blue) and column average (green) averaged over the Northern Hemisphere (left) and the Southern Hemisphere (right). The figure is based on simulation data used for Global CO2 Distribution.
Variations in monthly mean mole fractions exhibit considerable differences between the Northern Hemisphere and Southern Hemisphere (Figure 2). Periodic cycles are prominent in the former, while no clear seasonal variability is observed in the latter. This is mainly because the Northern Hemisphere has a larger land area, parts of which are characterized by high concentrations of human or plant activity. As a result, global average mole fractions are dominated by the characteristics of the Northern Hemisphere.
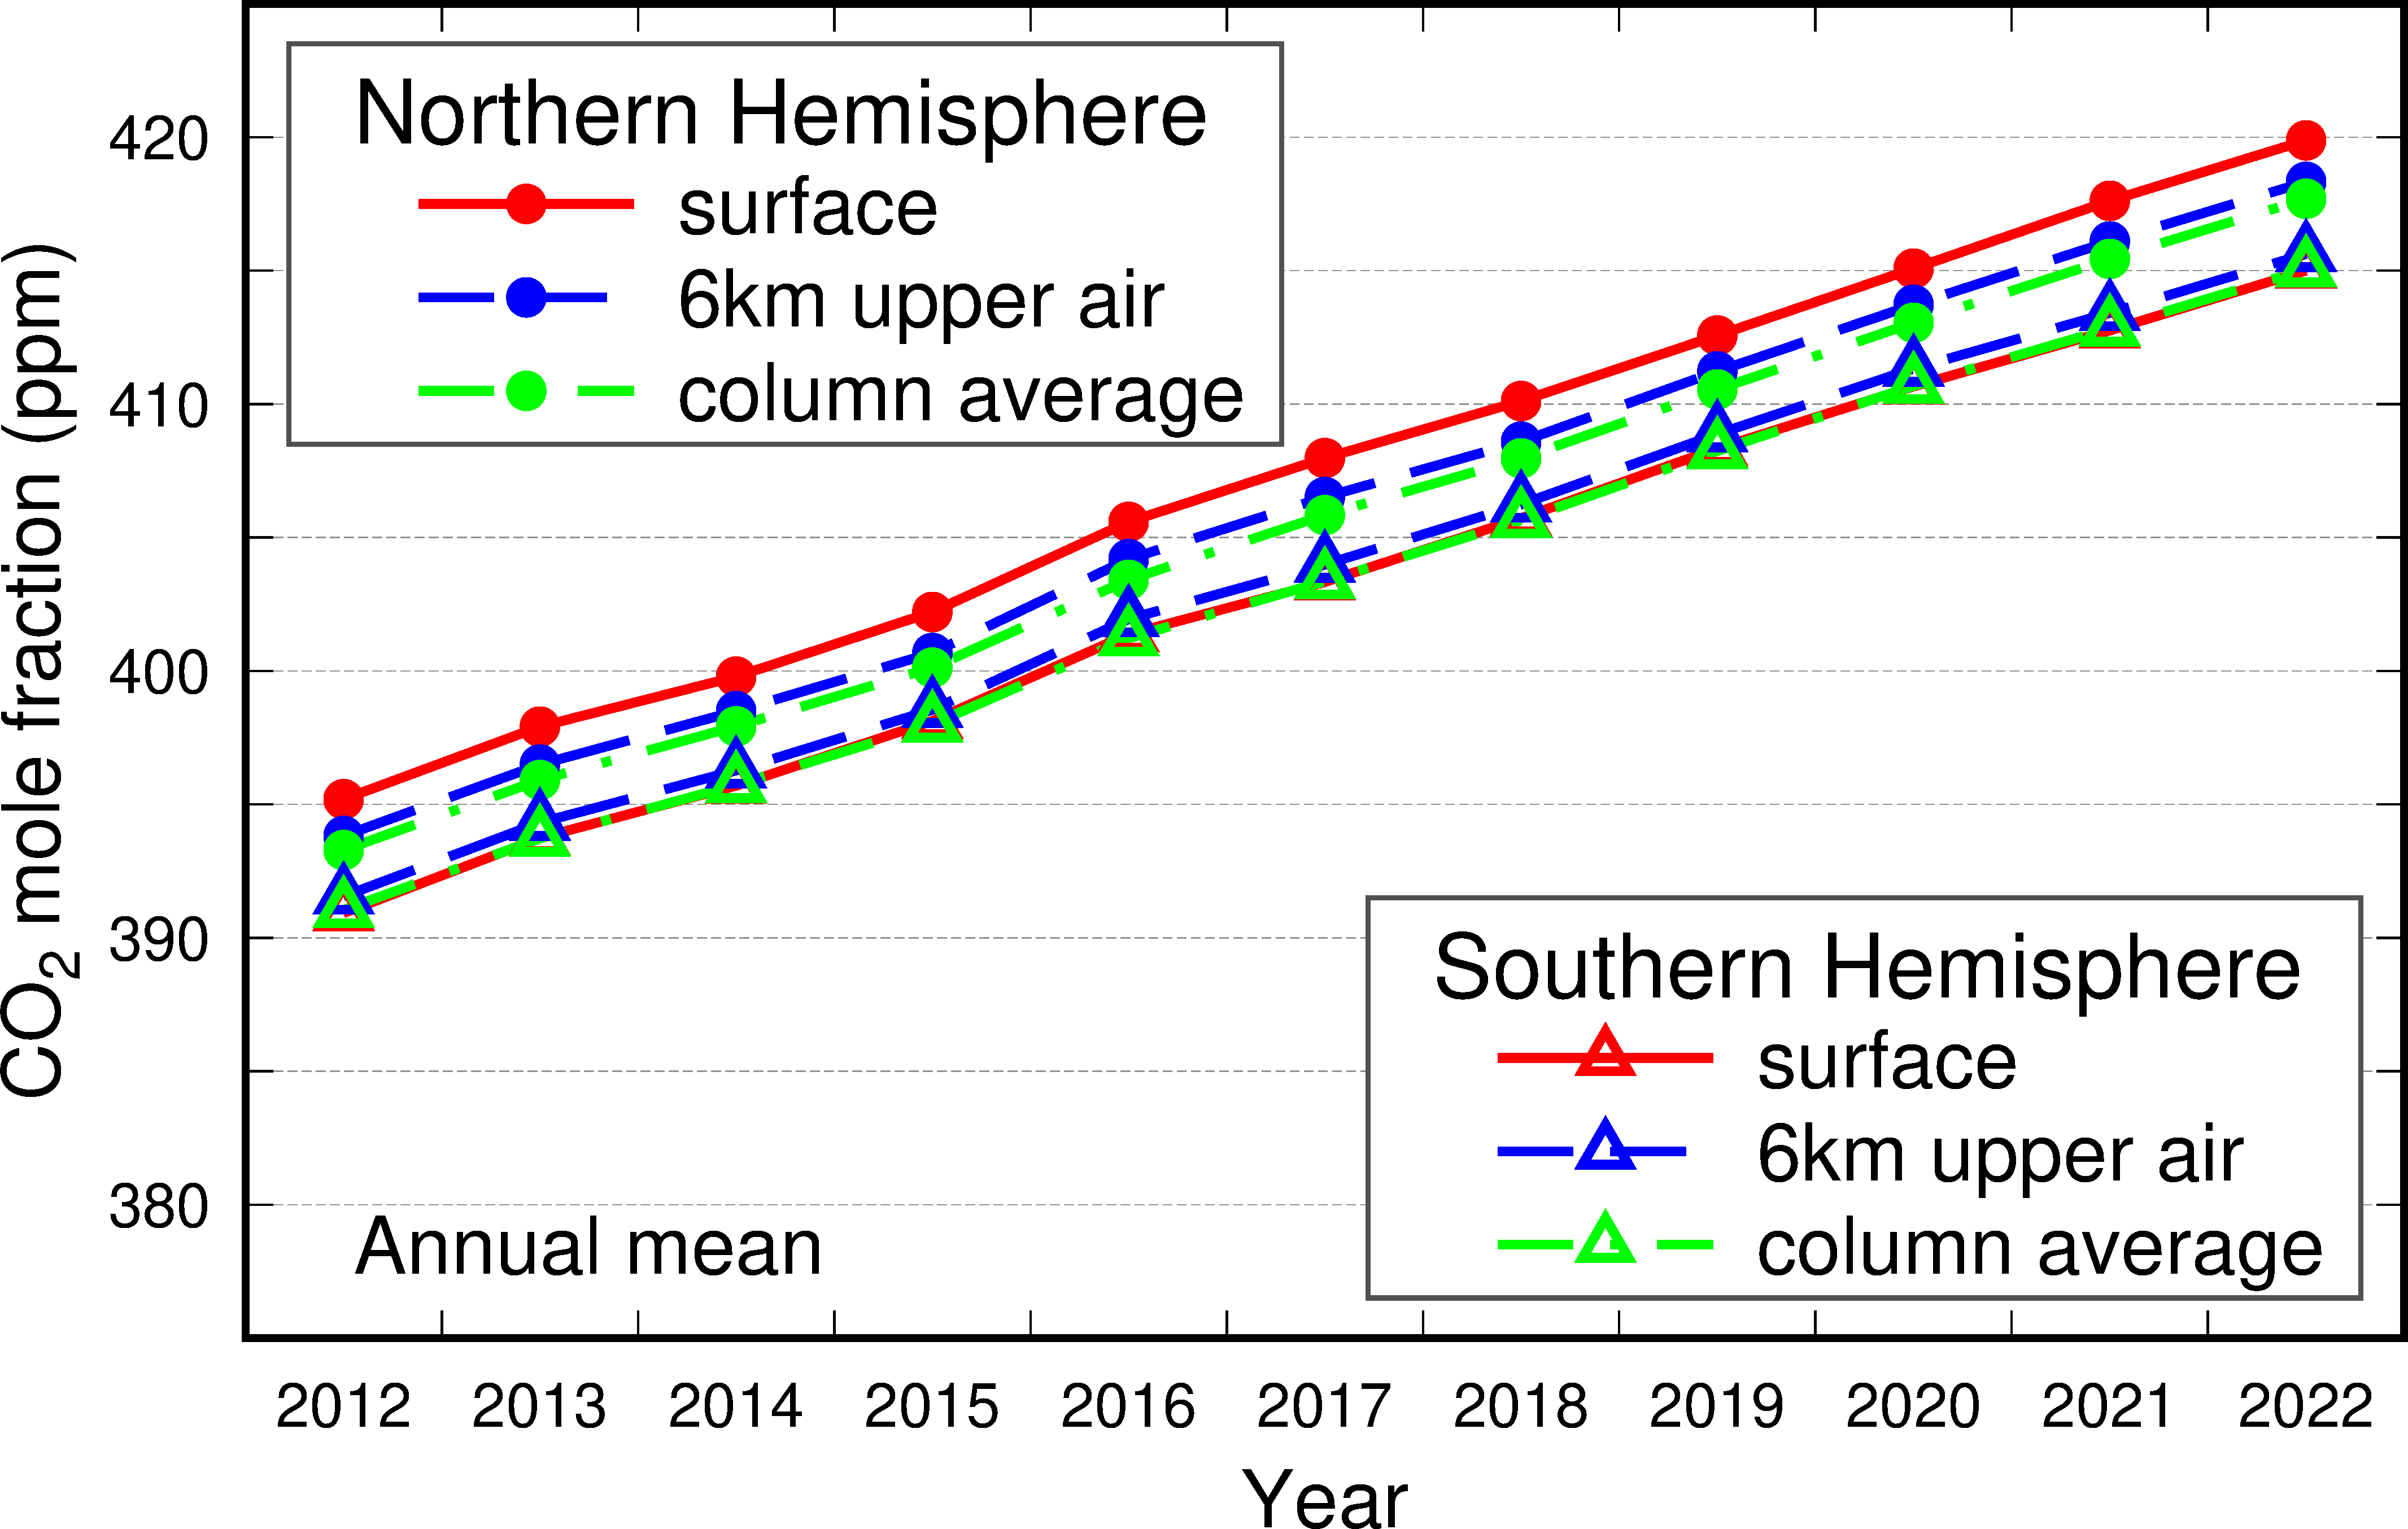
Figure 3. Annual mean CO2 mole fractions for the surface (red), upper air (blue) and column average (green) averaged over the Northern Hemisphere (dots) and the Southern Hemisphere (triangles). The figure is based on simulation data used for Global CO2 Distribution.
Figure 3 shows annual mean CO2 mole fractions for the surface (red), upper air (blue) and column average (green) for the Northern Hemisphere (dots) and the Southern Hemisphere (triangles). The gap between lines of the same color indicates the interhemispheric difference in mole fractions, which is smaller for the upper air and the column average than on the surface. This is mainly because the atmosphere at the surface in the Northern Hemisphere is more readily affected by human activity and tends to be characterized by high annual mean mole fractions.