Explanation on the Products for the Madden Julian Oscillation (MJO)
Time-longitude Cross Sections
Time-longitude cross sections of three and seven day mean outgoing longwave radiation (OLR), velocity potential, zonal wind and SST are useful in monitoring intraseasonal oscillations such as MJO. These products are available for the period since 1979.
MJO Indices
The indices for monitoring MJO are Real-time Multivariate MJO Indices defined by Wheeler and Hendon (2004), which is based on multivariate EOF analysis of daily 850 hPa zonal wind, 200 hPa zonal wind and OLR (15ºS-15ºN) for the period of 1991 - 2020.
The atmospheric data are based on the Japanese Reanalysis for Three Quarters of a century (JRA-3Q) (Kosaka et al. 2024).
OLR data are provided by the National Oceanic and Atmospheric Administration (NOAA).
To extract ENSO variation, NINO.3 index is used instead of the time series of the first rotated EOF of Indo-Pacific SSTs (SST1) (Drosdowsky and Chambers 2001).
To extract an MJO component from the 850 hPa zonal wind, 200 hPa zonal wind and OLR, the annual cycle and components of interannual variability (including ENSO) are removed.
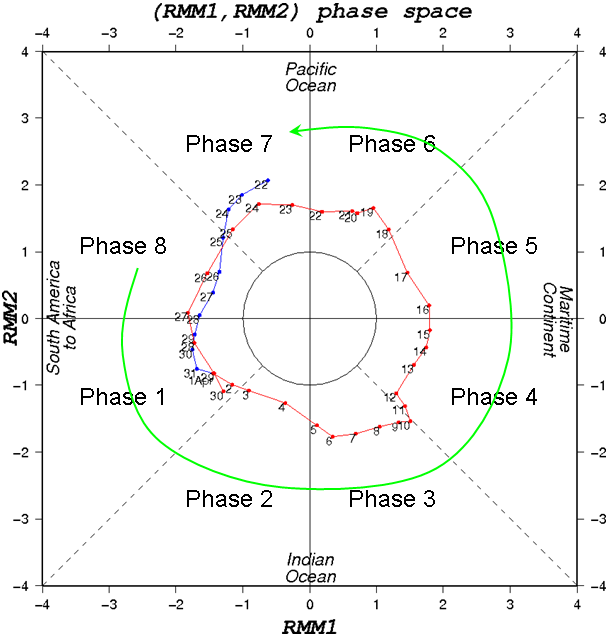
Two principal component time series from multivariate EOF of the MJO components are defined as RMM1 and RMM2. These scores are normalized by their standard deviations over the period from 1991 to 2020. Two-dimensional phase space is defined by RMM1 and RMM2.
The spatial structures of RMM1 and RMM2 are rotated with reference to the structures of Wheeler and Hendon (2004) due to the phase displacement of the EOF vectors.
In the phase space, the equatorial zones are divided into 8 phases (Fig.1) and each phase indicates the active phase of the MJO propagation.
In association with the eastward propagation of MJO, trajectory of RMM1 and RMM2 draws anti-clockwise circles in the phase space.
For the details of calculation procedures, please refer to Wheeler and Hendon (2004).
In addition to the original calculation, we generated another MJO Index, which is based on 850 hPa zonal wind, 200 hPa zonal wind and "200 hPa velocity potential".