Infrared inter-calibration of imagers on MTSAT-1R/-2 and Himawari-8/-9 using high-spectral-resolution sounders as references
The Meteorological Satellite Center (MSC) of Japan Meteorological Agency (JMA) has routinely performed inter-calibration between optical imagers on MTSAT/Himawari satellites (such as AHI on the Himawari-8 satellite) and high-spectral-resolution sounders (referred to here as hyper sounders). Data from the following three hyper sounders are used for this purpose.
- The Atmospheric Infrared Sounder (AIRS) is a multi-aperture array grating spectrometer on board the Aqua satellite.
- The Infrared Atmospheric Sounding Interferometer (IASI) is a Fourier transform spectrometer on board the Metop satellites.
- The Cross-track Infrared Sounder (CrIS) is a Fourier transform spectrometer on board the Suomi-NPP and the JPSS satellites.
The infrared inter-calibration results are updated once a day. The hyper-sounder data used in this work are collected via the Internet. The results may not be uploaded in case of poor network conditions. As of April 2023, Himawari-8,-9/AHI and MTSAT-2/Imager infrared inter-calibration products with reference to AIRS and IASI (GSICS Corrections) are in the GSICS Demonstration Phase. The inter-calibration products using CrIS as a reference will also be submitted to Demonstration Phase. Regarding the maturity level of GSICS Products, please refer to GSICS Product Catalog.
Outcome
The results of this inter-calibration work have three statistical parameters. It should be noted that the results contain a certain level of uncertainty caused due to variations in instrument accuracy, differences in observation conditions and spectral compensation residuals.
Regression coefficients between hyper sounders and GEO imagers observation
Linear regression coefficients (C0 and C1) and their standard uncertainties are computed to allow association of geostationary (GEO) imager's radiance with hyper sounder radiance. The radiance is in wavenumber space, and its unit is mW.m-2.sr-1.cm.
Radiance (GEO) = C0 + C1 × Radiance (hyper sounder)
Please note that GEO radiance data are retrieved from Himawari Standard Data (HSD) for Himawari-8/-9 AHI (referred to here as AHI-8 and AHI-9) and High Rate Information Transmission (HRIT) for MTSAT-1R/JAMI and MTSAT-2/Imager. In the case of MTSAT-2/Imager, the following regression using GEO digital counts is also performed for the convenience of users.
Digital counts (GEO) = C0 + C1 × Radiance (hyper sounder)
GSICS Correction
GSICS Correction is the initial core product of GSICS. It is a dataset that allows users to determine corrected satellite radiances based on the results of inter-calibration, which consists of the above linear regression coefficients (C0 and C1). Corrected satellite radiances are calculated using the following equation:
Corrected radiance (AHI) = HSD radiance (AHI) / C1 − C0 / C1
GSICS Correction is routinely computed and updated once a day for the operational sensor. To reduce the random component of uncertainty, correction is derived from data over 29- and 15-day time periods for Re-Analysis Correction (RAC) and Near Real Time Correction (NRTC), respectively. The smoothing period for RAC is t - 14 days to t + 14 days, and that for NRTC is t - 14 days to t + 0 days (where t is the date of validity). GSICS Correction files (netCDF) are available on GSICS Collaboration Server. The same correction values are also stored in CSV files, which are available at MSC's calibration monitoring page.
TB difference between hyper sounders and GEO imagers
The brightness temperature (TB) difference (i.e. GEO imagers value minus hyper sounder value) and its standard uncertainties are computed at reference temperatures of standard radiance, 290 K, 250 K, and 220 K.
d Tb = Tb (GEO) − Tb (hyper sounder)
A standard radiance is defined by GSICS to allow comparison and convenient expression of instrument inter-calibration bias in units that are understandable to users.
The standard radiance was calculated for each channel of GEO imager by standard radiative transfer model in a 1976 US Standard Atmosphere at nadir, at night, in clear sky, and over the sea with an SST of 288.15K and a wind speed of 7m/s. RTTOV-11.2 is used for Himawari-8/-9 AHI and RTTOV-9 is used for MTSAT-1R/JAMI and MTSAT-2/Imager.
| Band name (µm) |
Band7 (3.9) | Band8 (6.2) | Band9 (6.9) | Band10 (7.3) | Band11 (8.6) |
Band12 (9.6) | Band13 (10.4) | Band14 (11.2) | Band15 (12.4) | Band16 (13.3) |
| AHI-8 | 285.95 | 234.65 | 243.85 | 254.59 | 283.82 | 259.45 | 286.18 | 286.10 | 283.78 | 269.73 |
| AHI-9 | 286.02 | 234.75 | 244.20 | 254.77 | 283.88 | 259.33 | 286.22 | 286.16 | 283.92 | 268.53 |
| Channel name (µm) |
IR1 (10.8) | IR2 (12.0) | IR3 (6.8) | IR4 (3.8) |
| MTSAT-1R/JAMI | 286.67 | 285.91 | 238.37 | 286.51 |
| MTSAT-2/Imager | 286.70 | 285.94 | 239.17 | 286.53 |
Conversion between brightness temperature and radiance
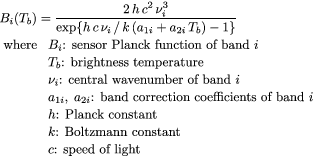
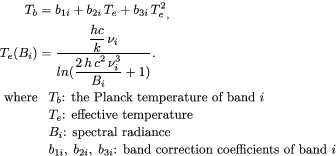
The Planck function and sensor spectral response functions are used to compute brightness temperature [K] from radiance [mW.m-2.sr-1.cm] and vice-versa. In general, approximation equations called sensor Planck functions, which are generated for infrared bands of the GEO imagers, are used to facilitate computation.
| Brightness temperature to radiance | Radiance to brightness temperature |
|---|---|
 |
 |
| AHI band | Wavenumber | Band correction coefficients | |||||
|---|---|---|---|---|---|---|---|
| ν (cm-1) | a1 | a2 | b1 | b2 | b3 | ||
| Band7 (3.9 µm) | AHI-8 | 2575.767 | 0.4646738 | 0.9993416 | -0.479757 | 1.000766 | -1.860569e-07 |
| AHI-9 | 2613.607 | 0.4517128 | 0.9993711 | -0.462818 | 1.000709 | -1.376448e-07 | |
| Band8 (6.2 µm) | AHI-8 | 1609.241 | 1.646845 | 0.9964012 | -1.662616 | 1.003694 | -1.732716e-07 |
| AHI-9 | 1607.897 | 1.631702 | 0.9964356 | -1.643762 | 1.003627 | -1.015974e-07 | |
| Band9 (6.9 µm) | AHI-8 | 1442.079 | 0.3081354 | 0.9992591 | -0.3357036 | 1.000974 | -4.847962e-07 |
| AHI-9 | 1438.940 | 0.2696262 | 0.9993508 | -0.2934427 | 1.000851 | -4.193033e-07 | |
| Band10 (7.3 µm) | AHI-8 | 1361.387 | 0.05736947 | 0.9998543 | -0.06306013 | 1.000195 | -1.069833e-07 |
| AHI-9 | 1361.95 | 0.05705145 | 0.9998552 | -0.06265289 | 1.000194 | -1.053029e-07 | |
| Band11 (8.6 µm) | AHI-8 | 1164.443 | 0.1351275 | 0.9996156 | -0.1605105 | 1.000589 | -4.019762e-07 |
| AHI-9 | 1164.303 | 0.1318540 | 0.9996248 | -0.1567172 | 1.000576 | -3.937500e-07 | |
| Band12 (9.6 µm) | AHI-8 | 1038.108 | 0.09363042 | 0.9997033 | -0.1143507 | 1.000473 | -3.671680e-07 |
| AHI-9 | 1039.153 | 0.09237552 | 0.9997075 | -0.1127442 | 1.000466 | -3.609458e-07 | |
| Band13 (10.4 µm) | AHI-8 | 961.333 | 0.08965492 | 0.9997001 | -0.1192115 | 1.000539 | -4.680314e-07 |
| AHI-9 | 961.334 | 0.09140126 | 0.9996943 | -0.1214194 | 1.000548 | -4.753535e-07 | |
| Band14 (11.2 µm) | AHI-8 | 890.741 | 0.1800931 | 0.9993562 | -0.2530423 | 1.001233 | -1.153788e-06 |
| AHI-9 | 893.216 | 0.1767254 | 0.9993697 | -0.2478741 | 1.001205 | -1.125339e-06 | |
| Band15 (12.4 µm) | AHI-8 | 809.242 | 0.2439072 | 0.9990461 | -0.3766459 | 1.002025 | -2.096994e-06 |
| AHI-9 | 810.250 | 0.2415780 | 0.9990565 | -0.3724054 | 1.001999 | -2.066874e-06 | |
| Band16 (13.3 µm) | AHI-8 | 753.369 | 0.06235635 | 0.9997371 | -0.09773197 | 1.000564 | -6.266746e-07 |
| AHI-9 | 751.674 | 0.06235800 | 0.9997365 | -0.09792520 | 1.000566 | -6.300657e-07 | |
| Channel | Wavenumber | Band correction coefficients | |||||
|---|---|---|---|---|---|---|---|
| ν (cm-1) | a1 | a2 | b1 | b2 | b3 | ||
| IR1 (10.8 µm) | MTSAT-1R | 926.6118 | 0.3592380 | 0.9987587 | -0.4922710 | 1.0023139 | -2.0999958e-06 |
| MTSAT-2 | 926.4627 | 0.3597581 | 0.9987568 | -0.4043903 | 1.0018867 | -1.6805293e-6 | |
| IR2 (12.0 µm) | MTSAT-1R | 833.1675 | 0.1968675 | 0.9992525 | -0.2912983 | 1.0015096 | -1.4932396e-06 |
| MTSAT-2 | 835.6672 | 0.2195110 | 0.9991676 | -0.3277700 | 1.0017059 | -1.7109333e-06 | |
| IR3 (6.8 µm) | MTSAT-1R | 1482.2068 | 0.3785336 | 0.9991187 | -0.4170332 | 1.0011905 | -6.0493393e-07 |
| MTSAT-2 | 1476.6898 | 0.3645235 | 0.9991492 | -0.4011279 | 1.0011449 | -5.7546785e-07 | |
| IR4 (3.8 µm) | MTSAT-1R | 2652.9316 | 2.3473427 | 0.9969755 | -2.1144786 | 1.0011233 | 3.6944401e-06 |
| MTSAT-2 | 2684.1181 | 2.4635230 | 0.9967825 | -2.2533066 | 1.0014931 | 3.3511279e-06 | |
Algorithm
To allow comparison of data between GEO imagers and hyper sounders, information from simultaneous observations is first collocated. Radiances observed via hyper sounder channels are then accumulated in line with the spectral responses of the GEO imagers' infrared bands to enable estimation of those radiances.
The footprint size of the hyper sounders is about 12 km at nadir, whereas that of the AHI infrared bands and MTSAT imagers are 2 km and 4 km, respectively. To offset this difference, sounder radiance is compared with an average value for AHI radiances over a box of 7 × 7 pixels (FOV_BOX) corresponding to the sounder footprint. In the case of MTSAT imagers, FOV_BOX is considered as 3 × 3 pixels.
The October 2023 algorithm update does not exclude negative radiance in AHI or hyper sounder data processing, which results particularly in reduced negative biases in AHI B07 against IASI.
The collocation and spectral compensation methods are briefly described below. Further details are provided in Tahara and Kato (2009).
Collocation method
The collocation algorithms used in inter-calibration are determined by the GSICS Research Working Group (Hewison et al., 2013). GEO imagers and hyper sounder data meeting the criteria outlined below are selected.
-
Observation time difference check
| tGEO − tsounder | < dtmax
-
Satellite zenith angle difference check
| cos( SZAsounder ) / cos( SZAGEO ) − 1 | < MaxRate_OptPathDiff
-
Environment uniformity check
To mitigate discrepancies between the observation conditions of the two satellites caused by variables such as time difference, optical path difference and navigation error, only measurements taken over uniform scenes are selected and compared. In this checking, the uniformity of AHI radiance data over a box of 21 × 21 pixels (ENV_BOX) is tested using the following condition. In the case of MTSAT imagers, ENV_BOX is considered as 9 × 9 pixels.STDV(GEO radiances in ENV_BOX) < MaxSTDV
-
Normality check
Hyper sounder radiance is compared to average GEO radiance over the corresponding FOV_BOX. The AHI radiance data in the FOV_BOX should therefore represent those in the ENV_BOX as evaluated by the environment uniformity check. The normality of the GEO radiance data in the FOV_BOX is checked using the following condition. FOV_LENGTH is a side of FOV_BOX.| MEAN(FOV_BOX) − MEAN(ENV_BOX) | × FOV_LENGTH / STDV(ENV_BOX) < Gaussian
The tables below show the criteria used in inter-calibration between GEO imagers and AIRS/IASI/CrIS. The values differ according to weather conditions. In this work, if the brightness temperature of Band13/IR1 exceeds 275 K, the scene condition is categorized as clear, otherwise, it is categorized as cloudy.
Please note that different parameters (i.e. FOV_LENGH = 18 and Gaussian = 2 and 3 for Band8 to Band10 and other bands) had been used for the AHI-8 processing until 1 November 2017. Even though the impacts of the parameter change on the inter-calibration results are negligible small, AHI-8 inter-calibration would be re-processed in future.
| AHI band | Condition | dtmax (minutes) | MaxRate OptPathDiff | MaxSTDV (mW.m-2.sr-1.cm) | Gaussian | |
|---|---|---|---|---|---|---|
| AHI-8 | AHI-9 | |||||
| Band7 (3.9 µm) | Clear | 5 | 0.01 | 0.0238 | 0.0217 | 2 |
| Cloudy | 5 | 0.03 | 0.0476 | 0.0434 | ||
| Band8 (6.2 µm) | All | 5 | 0.01 | 0.371 | 0.372 | 1 |
| Band9 (6.9 µm) | All | 5 | 0.01 | 0.561 | 0.565 | 1 |
| Band10 (7.3 µm) | All | 5 | 0.01 | 0.661 | 0.661 | 1 |
| Band11 (8.6 µm) | Clear | 5 | 0.01 | 1.18 | 1.18 | 2 |
| Cloudy | 5 | 0.03 | 2.36 | 2.36 | ||
| Band12 (9.6 µm) | Clear | 5 | 0.01 | 1.46 | 1.46 | 2 |
| Cloudy | 5 | 0.03 | 2.92 | 2.92 | ||
| Band13 (10.4 µm) | Clear | 5 | 0.01 | 1.62 | 1.62 | 2 |
| Cloudy | 5 | 0.03 | 3.24 | 3.24 | ||
| Band14 (11.2 µm) | Clear | 5 | 0.01 | 1.77 | 1.76 | 2 |
| Cloudy | 5 | 0.03 | 3.54 | 3.52 | ||
| Band15 (12.4 µm) | Clear | 5 | 0.01 | 1.91 | 1.91 | 2 |
| Cloudy | 5 | 0.03 | 3.82 | 3.82 | ||
| Band16 (13.3 µm) | Clear | 5 | 0.01 | 2.03 | 2.03 | 2 |
| Cloudy | 5 | 0.03 | 4.06 | 4.06 | ||
| Channel | Condition | dtmax (minutes) | MaxRate OptPathDiff | MaxSTDV (mW.m-2.sr-1.cm) | Gaussian |
|---|---|---|---|---|---|
| IR1 (10.8 μm) | Clear | 5 | 0.01 | 1.65 | 2 |
| Cloudy | 5 | 0.03 | 3.31 | 2 | |
| IR2 (12.0 μm) | Clear | 5 | 0.01 | 1.82 | 2 |
| Cloudy | 5 | 0.03 | 3.64 | 2 | |
| IR3 (6.8 μm) | All | 5 | 0.01 | 0.311 | 1 |
| IR4 (3.8 μm) | Clear | 5 | 0.01 | 0.0151 | 2 |
| Cloudy | 5 | 0.03 | 0.0302 | 2 |
Spectral response compensation method
The collocated GEO and hyper sounder data cannot be compared without consideration of the sensors' spectral response difference. In this work, the averaged GEO radiance over the FOV_BOX is compared with the super channel radiance Isuper, which is generated from an accumulation of the hyper sounder radiances Ijsounder.
Iisuper = Σj wij Ijsounder,
where i is the GEO band number and j is the hyper sounder channel number.
wij represents constants computed in advance to precisely fit the spectral response of the super channel to that of the GEO infrared band i.
If the spectral range of the hyper sounder does not fully cover the GEO spectral range and/or any hyper sounder channel measurements are missing, spectral compensation is applied to the super channel radiance. This is done by evaluating the valid radiance measurements of the hyper sounder and radiances simulated beforehand for eight model profiles including clear and cloudy conditions. For further information on the super channel and the spectral compensation methods, please refer to Tahara (2008) and Tahara and Kato (2009).
References
- JMA, 2023: Algorithm Theoretical Basis Document (ATBD) for GSICS Infrared Inter-Calibration of Imagers on MTSAT-1R/-2 and Himawari-8/-9 using AIRS and IASI Hyperspectral Observations.
- Hewison, T. J., X. Wu, F. Yu, Y. Tahara, X. Hu, D. Kim and M. Koenig, 2013: GSICS Inter-Calibration of Infrared Channels of Geostationary Imagers Using Metop/IASI, IEEE Transactions on Geoscience and Remote Sensing, Vol. 51, No. 3, 1160-1170.
- Tahara, Y., 2008: New Approach to Inter-calibration Using High Spectral Resolution Sounder, Meteorological Satellite Center Technical Note, No. 50, 1-14.
- Tahara,Y. and K. Kato., 2009: New Spectral Compensation Method for Inter-calibration Using High Spectral Resolution Sounder, Meteorological Satellite Center Technical Note, No. 52, 1-37.