HOME > Ensemble Model Prediction > Warm/Cold Season Prediction > Northern Hemisphere

Warm/Cold Season Prediction (Northern Hemisphere)

This product is displayed for use by National Meteorological and Hydrological Services (NMHSs). It does not constitute an official forecast for any nation.

Forecast Maps

initial date


Forecast range : 3 months mean
[initial : Feb,Mar,Apr
=> average of JJA (for warm season outlook)]
[initial : Sep,Oct
=> average of DJF (for cold season outlook)]

coresponding verification

LT : lead time(day)
kt : lead time(hour)

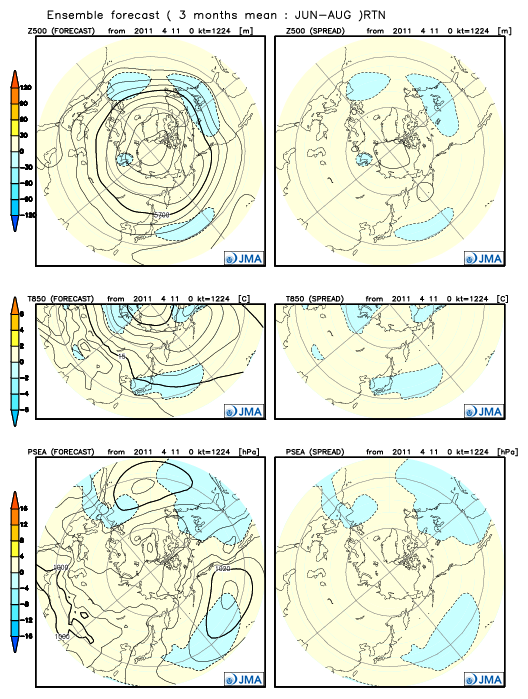
[FORECAST](left figures)
top : Contours show 500hPa height in an interval of 60m.
middle : Contours show 850hPa temperature in an interval of 3C.
bottom : Contours show sea level pressure in an interval of 4hPa.
(Shaded patterns show anomalies.)

[SPREAD](right figures)
top : Contours show spread of 500hPa height in an interval of 30m.
middle : Contours show spread of 850hPa temperature in an interval of 2C.
bottom : Contours show spread of sea level pressure in an interval of 4hPa.
(Shaded patterns show anomalies.)


page top