GTSPP Data Product CentreGTSPP Data Product Centre
GTSPP Data Product Centre for the North Pacific Region hosted by the Japan Meteorological Agency
Quality control procedures
Observation data collected by JMA via GTS (the Global Telecommunication System) is subjected to a set of quality control procedures before being compared with the assimilation result.
JMA implements four quality control procedures to remove erroneous data as detailed below.
1 . Grounded test
This test involves the use of topography data on a 5-minute latitude/longitude grid called
″etopo5″.
The data are generated by NODC from a digital database of land and sea-floor elevations.
First, the closest grid point to the observation station is detected, and the eight grid points surrounding it are chosen.
Then, the deepest and the shallowest points among the nine grid points are found.
If the difference between the two is greater than 10m, the depth threshold value at the station (MaxD) is defined as:
MaxD = Dmax + (Dmax - Dmin) * 2If the difference is smaller than 10m, it is defined as:
MaxD = Dmax + 20where
Dmax = maximum depth among the nearest gird point and its neighboring grid pointsValues from the observation level under the depth threshold (MaxD) are regarded as grounded data, and are excluded from the data procedure.
Dmin = minimum depth among the nearest gird point and its neighboring grid points
2 . Position-on-land test
This test is used to find land-based observations from land-sea mask data on a 0.5-degree latitude/longitude grid made by JMA.
Based on the observation position, the nearest grid point and the surrounding eight grid points are detected.
If all nine points are on land, the location is flagged and the profile is excluded from the data procedure.
3 . Regional range test
This test is used to exclude extreme values from observation data.
The data are classified into individual ocean regions (Figure 1), and the minimum and maximum temperatures corresponding to the observation depth are determined empirically for each one (Table 1).
If the observation temperature is outside the range, it is flagged and excluded from the data procedure.
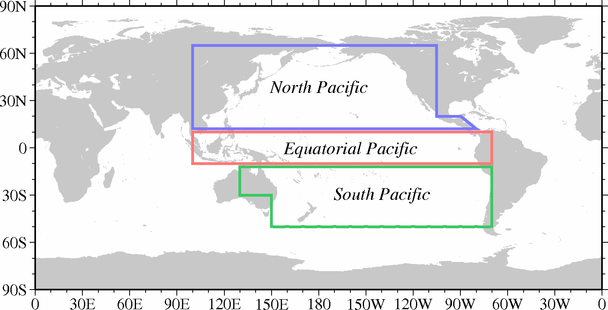
Figure 1. ocean regions
Table 1. Minimum and maximum temperatures for each depth
In the table, values divided by a slash denote pairs of minimum (left) and maximum (right) temperatures.
| Region name | ||||
| Depth range | North Pacific | Equatorial Pacific | South Pacific | Other areas |
|---|---|---|---|---|
| 0 - 99m | -2.0/35.0 | 5.0/35.0 | -2.0/32.0 | -2.0/37.0 |
| 100 - 249m | -2.0/30.0 | 5.0/30.0 | -2.0/30.0 | -2.0/37.0 |
| 250 - 349m | -2.0/28.0 | 5.0/28.0 | -2.0/28.0 | -2.0/37.0 |
| 350 - 599m | -2.0/28.0 | 5.0/28.0 | -2.0/28.0 | -2.0/25.0 |
| 600 - 999m | -2.0/20.0 | 0.0/20.0 | -2.0/20.0 | -2.0/25.0 |
| 1000 - 1749m | -2.0/18.0 | 0.0/18.0 | -2.0/18.0 | -2.0/25.0 |
| 1750m - | -2.0/13.0 | 0.0/13.0 | -2.0/13.0 | -2.0/25.0 |
4 . Gradient test
This test examines excessive decreases and increases in temperature.
The gradient of two temperatures of continuous levels (ΔT) is defined as:
ΔT = (T1 - T2) / (Z1 - Z2)where
T1 = temperature at the current depthThe threshold values for excessive decreases and increases are listed in Table 2. If the gradient exceeds the threshold, deeper temperatures are flagged and excluded from the data procedure. In addition, checking is performed to identify any major temperature inversions of two continuous levels. If an inversion exceeding 3°C is found in a temperature pair, the deeper one is flagged and excluded from the data procedure.
T2 = temperature at the next deeper depth down
Z1 = current depth
Z2 = next depth down
Table 2. Gradient threshold values (°C/m)
| Depth range | Minimum | Maximum |
|---|---|---|
| 0 - 399m | -1.4 | 0.6 |
| 400m - | -0.7 | 0.3 |
Correspondence to the web page should be addressed to