GTSPP Data Product CentreGTSPP Data Product Centre
GTSPP Data Product Centre for the North Pacific Region hosted by the Japan Meteorological Agency


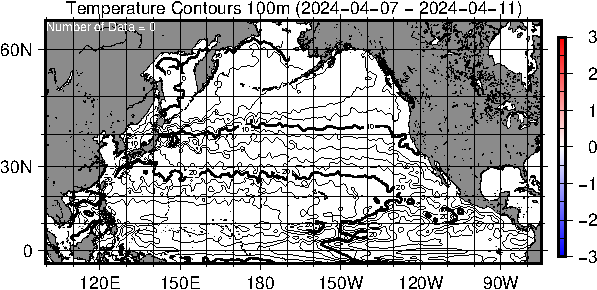
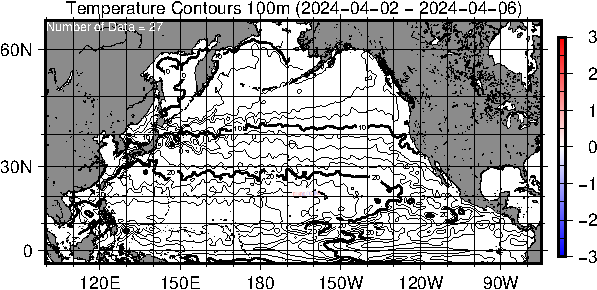
Temperature contours simulated by NPR-4DVAR at 100 m. The colors of the circles indicate the differences between the temperature data circulated on the Global Telecommunications System (GTS) and simulated by NPR-4DVAR. The unites of the color bar to the right of the figure is degree Celsius.
Activities of the GTSPP Data Product Centre for the North Pacific Ocean
1) Monitor the most recent 30-day data collections made by the the vessels travelling along the SOOP lines in the past few years.
2) Provide access to both in-situ observations along the SOOP lines, model simulations, and intercomparisons between them.
What's GTSPP?
The Global Temperature and Salinity Profile Programme(GTSPP) is an international cooperative developed by a group of marine and oceanic science organizations to provide researchers and marine operations managers with accurate, up-to-date temperature and salinity data. The World Meteorological Organization (WMO) and the Intergovernmental Oceanographic Commission (IOC) jointly manage the program’s network. Tasks in the GTSPP are shared amongst the participating countries including but not limited to Argentina, Australia, Canada, China, France, Germany, India, Italy, Japan, UK, and USA. Scientists and data managers in these countries contribute their time and resources to ensure the continued functioning of the program. You can find more information at the GTSPP web page.
What can you get from this web site?
You can find the comparisons between the in-situ data measured along the SOOP lines in the North Pacific and the result of a numerical oceanographic model operated by the Japan Meteorological Agency.
How to find the contents?
A) When you click "The last 30 days SOOP observation", you will find the list of vessels which make observations during recent 30 days. By clicking at the link to the ship name, you can find the results of the comparison between the observing data and the result of NPR-4DVAR.
B) From "Data on SOOP lines" or "SOOP ships" in the menu to the left, you can see the result of each cruise along the SOOP lines:
the trajectory of the vessel, a water fall graph of temperature, a section of in-situ data, a section of NPR-4DVAR result, and the difference between the observation and the model result.
1) When you click "Data on SOOP lines", you can search the result by SOOP line. When you click a line on the map or the line name below the map, you can get a list of cruises conducted along the line.
2) When you click "SOOP ships", you can search the result by ship which observed temperature / salinity profiles on the line within a few years. By clicking the ship name in which you are interested, a list of cruises conducted by the ship will be shown.
C) When you click "Search BATHY & TESAC by platform", you will go to the BATHY/TESAC monitor page. You can access BATHY / TESAC data within 30-day, excluding data of Argo floats, buoys, and coastal stations. From this page, you can access the data and the graph of the profile.
D) When you click "100m TS by NPR-4DVAR", you can watch the animation of temperatures / salinity simulated by NPR-4DVAR at 100m depth in a period of about one year.
What's NPR-4DVAR?
NPR-4DVAR is the data assimilation component of MOVE/MRI.COM-JPN, the JMA's operational system for monitoring and forecasting coastal and open-ocean states around Japan. It consists of an eddy-resolving model for the North Pacific and a four-dimensional variational (4DVAR) assimilation scheme. Observations of satellite along-track sea level anomalies, gridded sea surface temperature derived from MGDSST, in-situ temperature and salinity profiles are assimilated by 4DVAR with 10-day assimilation window. For more information, see the article of Hirose et al. (2019).
Correspondence to the web page should be addressed to