Explanation of Pacific Decadal Oscillation (PDO)
Notice: Regression patterns on the PDO index have replaced due to recalculation of the PDO index (23 January 2024).
PDO
In the North Pacific, the atmosphere and the ocean display a trend of co-variance with a period of about 20 years.
This variability is called the Pacific Decadal Oscillation (PDO).
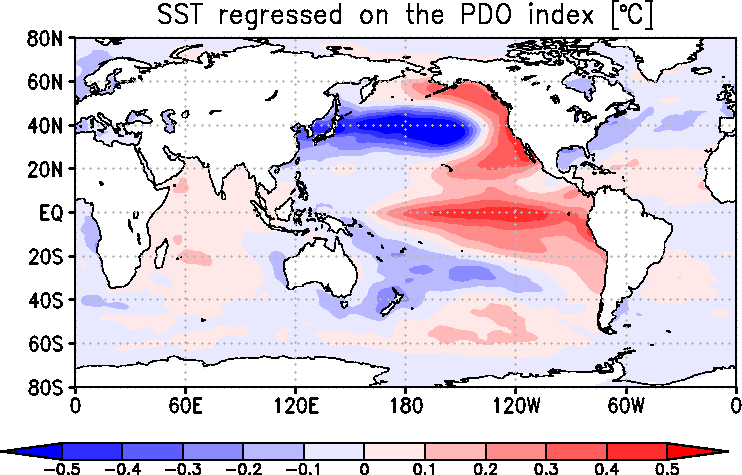
Supposing that SSTs are lower than their normals in the central part of the North Pacific,
they are likely to be higher than their normals both in the eastern part of the North Pacific and in the equatorial Pacific.
This seesaw pattern varies slowly, and appears repeatedly with a period of about 20 years.
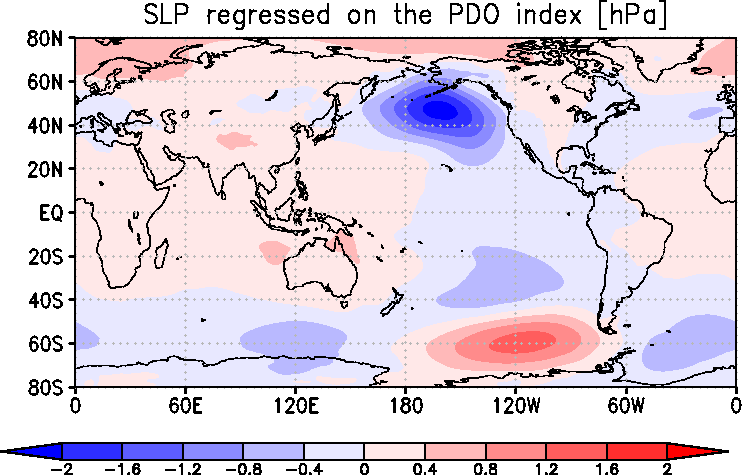
In this case, the Aleutian Low and the jet stream in the upper troposphere
tend to be strong.
The North Pacific Index (NPI) is
utilized as an indicator for the strength of the Aleutian Low.
As described above, ocean-atmosphere coupling causes decadal oscillation in the North Pacific.
Although some hypotheses have been proposed tp elucidate the mechanism behind the PDO, it is not yet fully understood.
|
Typical SST anomaly patterns in the positive phase of the PDO
This map shows the distribution of monthly SST anomalies (based on COBE-SST2) linearly regressed on the PDO index.
|
|
Typical SLP anomaly patterns in the positive phase of the PDO
This map shows the distribution of monthly SLP anomalies (based on JRA-3Q) linearly regressed on the PDO index.
|
Definition of the PDO index
The PDO index is an indicator of The Pacific Decadal Oscillation, and
defined as the projections of monthly mean SST anomalies onto their first EOF vectors in the North Pacific (north of 20ºN).
The EOF vectors are derived for the period from 1901 to 2000, and climatology is defined as monthly mean for the same period.
Globally averaged monthly mean SST anomalies are subtracted from each monthly mean SST anomaly before calculation of the first EOF vector
in order to eliminate the effects of the global warming.
Tokyo Climate Center, Climate Prediction Division.
Copyright(C) 2002. Japan Meteorological Agency.
-
Legal Notice -