 |
|
|||
Home |
World Climate |
Climate System Monitoring |
El Niño Monitoring |
NWP Model Prediction |
Global Warming |
Climate in Japan |
Training Module |
Press release |
Links |
JMA estimates global temperature anomalies using data combined not only over land but also over ocean areas.
The land part of the combined data for the period before 2010 consists of GHCN (Global Historical Climatology Network) information provided by NCDC (the U.S.A.'s National Climatic Data Center), while that for the period after 2011 consists of CLIMAT messages archived at JMA.
The oceanic part of the combined data consists of JMA's own long-term sea surface temperature analysis data, known as COBE-SST2 (Hirahara et al., 2014).
The procedure for estimating the global mean temperature anomaly is outlined below.
1) An average is obtained for monthly-mean temperature anomalies against the 1991-2020 baseline over land in each 5° x 5° grid box worldwide.
2) An average is obtained for monthly mean sea surface temperature anomalies against the 1991-2020 baseline in each 5° x 5° grid box worldwide in which at least one in-situ observation exists.
3) An average is obtained for the values in 1) and 2) according to the land-to-ocean ratio for each grid box.
4) Monthly mean global temperature anomaly is obtained by averaging the anomalies of all the grid boxes weighted with the area of the grid box.
5) Annual and seasonal mean global temperature anomalies are obtained by averaging monthly-mean global temperature anomalies.
*) Since 19 May 2021, JMA has changed the reference period for calculation of each grid box's temperature anomaly from "1971-2000" to the same period as the baseline of global mean temperature anomalies of "1991-2020".
**) Anomalies against 20th century average (shown in annual/seasonal/monthly mean value graph pages) are calculated in relation to the 1991-2020 average before being averaged over the global and adjusted to 1901-2000.
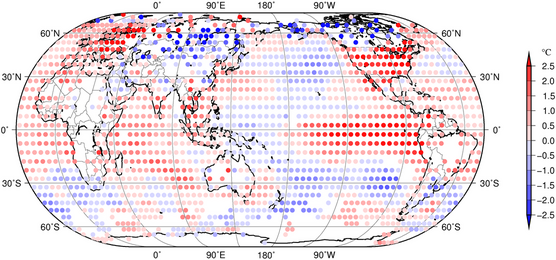
Image: average of temperature anomalies over land and sea according to the land-to-ocean ratio for each grid box
[Global Temperature Top]