The beginnings of Bai-u season 2006 were equal to or later than normal in most districts in Japan, and the ends were later than normal except the Okinawa and Amami districts. The total precipitation amounts during the Bai-u season were greater than normal in most districts in Japan. Some districts in main islands of Japan had significantly above-normal precipitation in July. The total sunshine durations during the Bai-u season were less than normal.
(1) The beginning and end of Bai-u season
The beginnings of Bai-u season were equal to or slightly later than normal in most districts in Japan, except for the Southern Kyushu and Southern Tohoku districts.
The ends of Bai-u season were delayed by about seven to ten days compared with normal year in most districts in Japan, except for the Okinawa and Amami districts. Especially in the Southern Kyushu district, it was later than normal by nearly two weeks.
(2) Activity of the Bai-u front and precipitation amounts during Bai-u season
The total precipitation amount during 2006 Bai-u season was above normal in most districts in Japan, except for the Nouthern Tohoku district. In the first half of June, the active Bai-u front tended to stay over Okinawa and Amami districts and to the south of the main islands of Japan. In the Amami distrct, significantly above-normal precipitation was observed during late May through middle June. In late June, the Bai-u front migrated northward and was located over the western Japan.
In July, the Bai-u front was located over the main islands of Japan and got remarkably active during the period from 15th to 24th of July. The record-breaking heavy rainfall during the period caused serious damage in some districts in the main islands of Japan (Special report on the extremely heavy rain in Japan in July 2006). Owing to the active Bai-u frontal activity, significantly above-normal monthly precipitations were observed at many districts in the main islands of Japan in July. On the other hand, the total precipitation amount during June and July was around 80% of the normal in the Northern Tohoku district.
(Yoshitsugu Nagasawa, Forecast Division / Shunji Takahashi, Climate Prediction Division)
| District | Beginning of Bai-u Period | End of Bai-u Period | Regional Mean Precipitation Ratio During Bai-u Season (Precipitation Ratio Rank) |
|||
| 2006 | Normal | 2006 | Normal | |||
| Okinawa | May 14th | May 8th | June 20th | June 23rd | 133% | (+) |
| Amami | May 11th | May 10th | June 22nd | June 28th | 151% | (+)* |
| Southern Kyushu | May 26th | May 29th | July 25th | July 13th | 116% | (+) |
| Nothern Kyushu | June 8th | June 5th | July 26th | July 18th | 140% | (+) |
| Shikoku | June 8th | June 4th | July 26th | July 17th | 118% | (+) |
| Chugoku | June 8th | June 6th | July 26th | July 20th | 147% | (+)* |
| Kinki | June 8th | June 6th | July 27th | July 19th | 139% | (+) |
| Tokai | June 8th | June 8th | July 26th | July 20th | 101% | (0) |
| Kanto-Koshin | June 9th | June 8th | July 30th | July 20th | 120% | (+) |
| Hokuriku | June 15th | June 10th | July 30th | July 22nd | 155% | (+)* |
| Southern Tohoku | June 9th | June 10th | August 2nd | July 23rd | 155% | (+)* |
| Northern Tohoku | June 15th | June 12th | August 2nd | July 27th | 83% | (−) |
There are several days of transitional period at the beginning and the end of Bai-u season. The central date of the transitional period is shown in the table. Normals are their average date during 1971-2000 period.
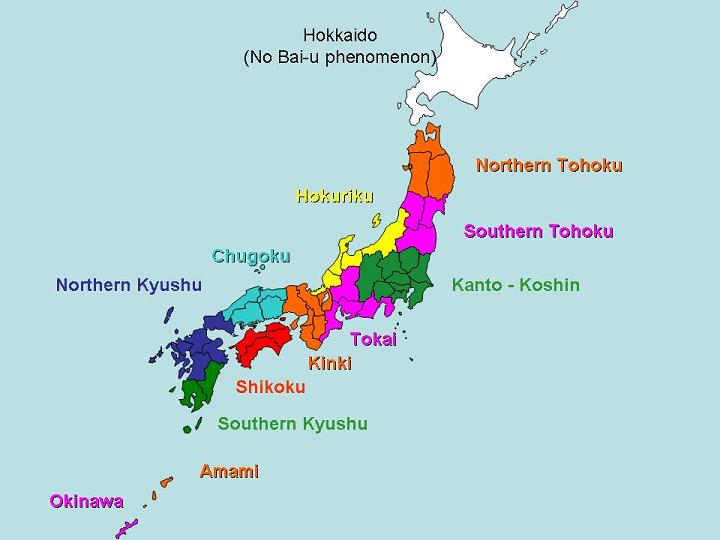
The regional mean precipitation amount during Bai-u season is calculated as the total rainfall amounts for two months (May and June for the Okinawa and Amami districts, and as June and July elsewhere) at several principal observatories in the district (Figure 1).
For the precipitation ratio rank, the symbol (+) means "Above Normal:Upper 33%", (0) "Near Normal:Medium 33%", (−) "Below Normal:Lower 33%", and the asterisk (*) indicates "Significantly above (or below) Normal:Upper (or Lower) 10%".
| Home | About Us | Topics | Data and Products | Long-Range Forecast | Library | Site Map | Related Links | Copyright & Disclaimer |