Extreme climate events and weather-related disasters during this period
Highlight
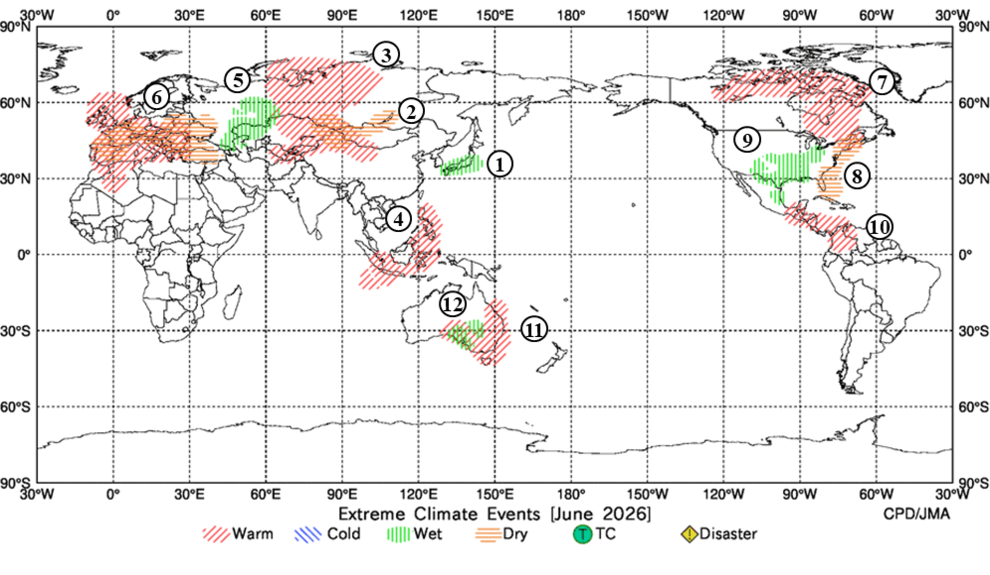
Monthly mean temperatures were extremely high from Western Siberia to eastern Central Asia, from the Philippines to Indonesia, from eastern to western Europe, in and around Saudi Arabia, in and around northeastern Canada, from the Florida Peninsula to Colombia via southern Mexico and in southeastern Australia.
Monthly precipitation amounts were extremely high from the Pacific side of northern Japan to western Japan, in and around western Kazakhstan, from the central USA to northern Mexico and in southern Australia.
Monthly precipitation amounts were extremely low from Lake Baikal to eastern Kazakhstan, from eastern to western Europe and along the East Coast of the USA.
Type
Area
Remarks
1
Wet
From the Pacific side of northern Japan to western Japan
2
Dry
From Lake Baikal to eastern Kazakhstan
3
Warm
From Western Siberia to eastern Central Asia
The monthly mean temperature in Russia was the second highest on record for June since 1891 (Hydrometcenter of Russia).
4
Warm
From the Philippines to Indonesia
The monthly mean temperature in Indonesia was the highest on record for June since 1991 (Indonesian Agency for Meteorology, Climatology and Geophysics).
5
Wet
In and around western Kazakhstan
6
Warm · Dry
From eastern to western Europe
In southwestern Belarus 40.4 degrees Celsius was recorded at Pinsk on 29 June, which is a new national maximum temperature record in Belarus (Belhydromet).
In western Poland 40.5 degrees Celsius was recorded at Slubice on 28 June, which is a new national maximum temperature record in Poland (Institute of Meteorology and Water Management).
In southwestern Slovakia 41.3 degrees Celsius was recorded at Kamenica nad Hronom on 30 June, which is a new national maximum temperature record in Slovakia (Slovak hydrometeorological institute).
In northern Hungary 42.0 degrees Celsius was recorded at Szecseny on 30 June, which is a new national maximum temperature record in Hungary (Hungarian Meteorological Service).
In the northwestern Czech Republic 41.9 degrees Celsius was recorded at Doksany on 28 June, which is a new national maximum temperature record in the Czech Republic (Czech Hydrometeorological Institute).
In Denmark 37.0 degrees Celsius was recorded at Beldringe and Odum on 27 June, which is a new national maximum temperature record in Denmark (Danish Meteorological Institute).
In eastern Germany 41.8 degrees Celsius was recorded at Mockern-Drewitz on 27 June, which is a new national maximum temperature record in Germany (Deutscher Wetterdienst, Germany).
The monthly mean temperature in Poland was the third highest on record for June since 1951 (Institute of Meteorology and Water Management).
The monthly mean temperature in the Czech Republic was the third highest on record for June since 1961 (Czech Hydrometeorological Institute).
The monthly mean temperature in Switzerland was the third highest on record for June since 1864 (MeteoSwiss).
The monthly mean temperature in Germany was the second highest on record for June, tied with 2003, since 1881 (Deutscher Wetterdienst, Germany).
The monthly mean temperature in France was the highest on record for June since 1900 (Meteo France).
The monthly mean temperature in the UK was the second highest on record for June since 1884 (UK Met Office).
The monthly mean temperature in Spain was the second highest on record for June since 1961 (The State Meteorological Agency, Spain).
The monthly precipitation amount in Spain was the third lowest on record for June since 1961 (The State Meteorological Agency, Spain).
7
Warm
In and around Saudi Arabia
8
Heavy Rain
Nigeria, Togo, Ghana and Cote d'Ivoire
It was reported that heavy rains caused a total of at least 90 fatalities in Nigeria, Togo, Ghana and Cote d'Ivoire (UN OCHA).
9
Warm
In and around northeastern Canada
10
Dry
The East Coast of the USA
11
Wet
From the central USA to northern Mexico
12
Warm
From the Florida Peninsula to Colombia via southern Mexico
13
Warm
Southeastern Australia
14
Wet
Southern Australia
The figure is based on CLIMAT report. Areas with missing or unreceived data are not shown.
Data and maps additionally provide detailed information for specific stations.