Japan Meteorological Agency |
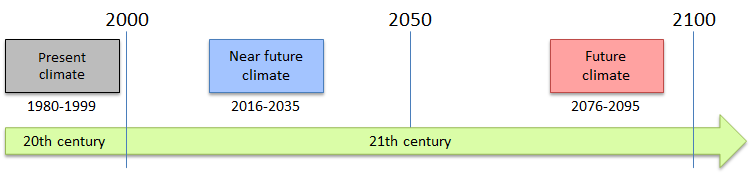
In GWPV8, the present climatology was defined as the average over a 20-year period at the end of 20th century (1980-1999), the near-future climatology was defined as the average over a 20-year period in the early 21st century (2016-2035), and the future climatology was defined as the average over a 20-year period in the late 21st century (2076-2095) (Fig. 1.2-1). The near-future and future projections are shown as differences from or ratios against the present climatology. For regionally averaged projections (shown later), statistical significance was tested by applying Student's t-test or Mann-Whitney's test at a 90% confidence level. Projected changes that were statistically significant at this confidence level were defined as increases or decreases. It should be noted that the inevitable model biases of the NHRCM were corrected by matching the probability density function (PDF) from model simulations with that from historical observation datasets for some statistics such as the annual number of high-temperature days and the frequency and percentile of precipitation and relative humidity. These statistics are plotted for the grid points nearest observation stations, as statistical correction is possible only when observational data are available (see Appendix for further details).
Some results reported in GWPV8 are displayed as regional averages or cumulative numbers of event occurrences for the seven climate regions shown in Figure 1.2-2 (the Sea of Japan side of northern Japan (NJJ), the Pacific side of northern Japan (NJP), the Sea of Japan side of eastern Japan (EJJ), the Pacific side of eastern Japan (EJP), the Sea of Japan side of western Japan (WJJ), the Pacific side of western Japan (WJP), and Okinawa/Amami (OKI)). Maximum snow depth and snowfall in Okinawa/Amami are not shown because snowfall is extremely rare in this region.
 |
 |
 |