Japan Meteorological Agency |
In general, uncertainties are inevitable in future climate projections. This section outlines several important points to be noted in the interpretation of climate projection and its uncertainties before the results from the NHRCM are introduced.
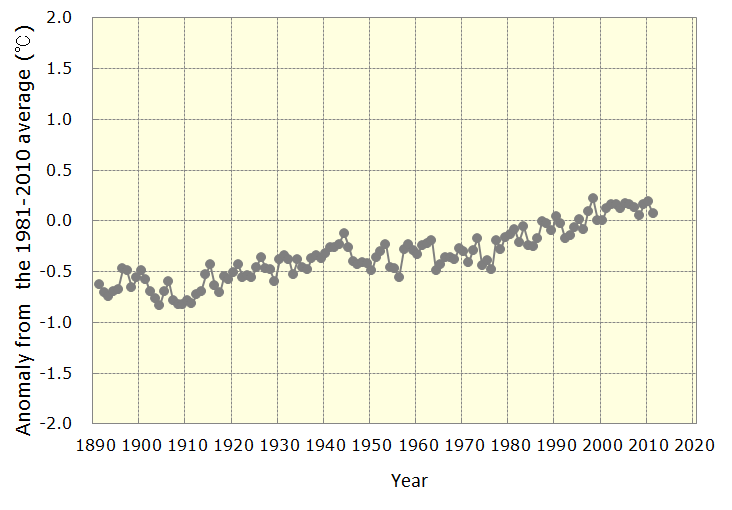
The conditions of the earth's atmosphere and oceans fluctuate on various temporal and spatial scales. As seen in Figure 1.3-1, for example, a time-series representation of annual mean global temperature anomalies can be broken down into long-term (red) and short-term (blue) components. The former is considered to be a response to external forcing elements such as increased atmospheric greenhouse gas concentrations, while the latter relates to internal natural variability on annual to decadal time scales.
In general, even state-of-the-art climate models cannot predict natural variability (e.g., amplitude and phase) more than a few years ahead. In the context of future climate change projection, such models are instead expected to project the response of the earth's climate system to external forcing agents. With this in mind, annual to decadal peaks and troughs seen in climate model outputs will not necessarily manifest in the real world, and can therefore be seen as useless and even confusing in global warming projection. Although it is impossible to completely exclude the effects of natural variability, a sufficiently long-term climatological average (typically over 20 years or longer) allows the extraction of information highlighting climate change associated with global warming. Accordingly, the 20-year average of results from the NHRCM are used for global warming projection.
 |
 |
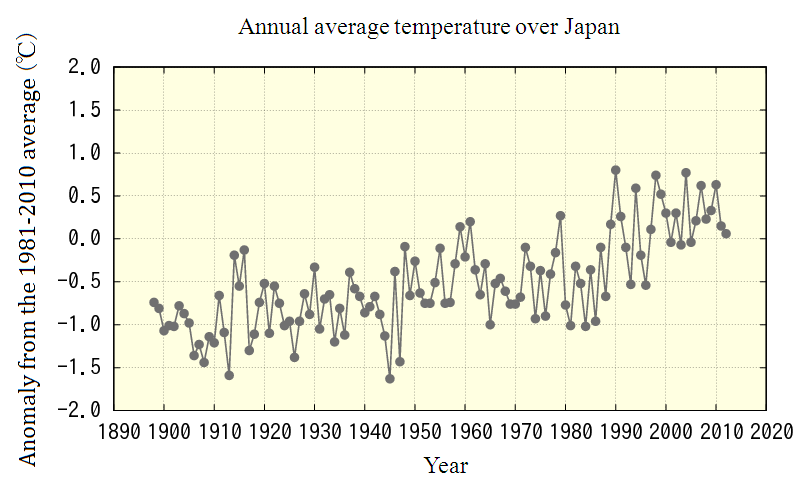
The manifestation of natural variability in regional-scale climate projections is generally greater than that in global and continental-scale projections. By way of example, the variance of annual mean temperatures over Japan is greater than that of annual mean global temperatures (Fig. 1.3-2). On a regional scale, the magnitude of natural internal variability sometimes overwhelms climate change signals in the background, which makes it difficult to identify responses to external forcing. This is also true for future projections using a climate model; uncertainties in regional-scale climate projections are greater than those in global-scale projections. It is therefore necessary to examine whether projected regional-scale climate change is consistent with broader-scale climate change, and whether it can be deductively explained as a response to external forcing before NHRCM output is used.
 |
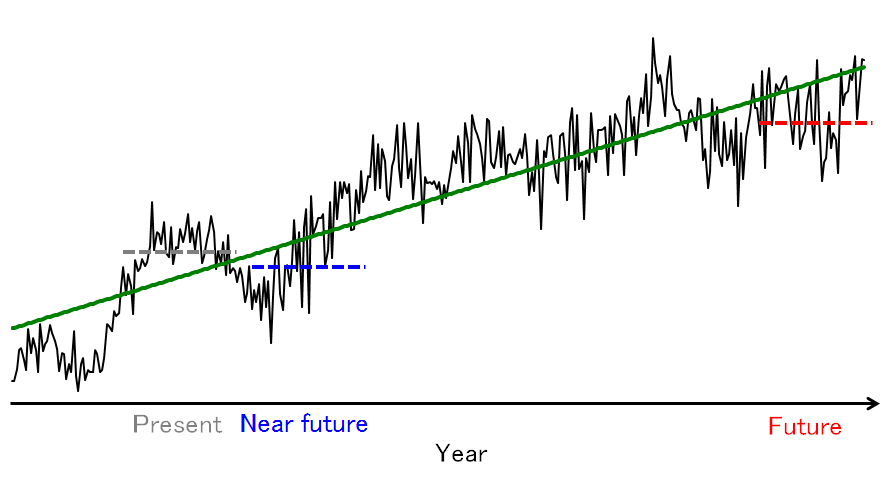
Future warming largely depends on changes in atmospheric greenhouse gas concentration. In GWPV8, numerical experiments for the near future (2016-2035) and the future (2076-2095) are presented. As the level of greenhouse gas concentration in near-future projections is expected to be lower than that in future projections, less pronounced climate change signals may be dominated by natural variability (Fig. 1.3-3). As explained in the previous section, natural variability should be considered as a complicating factor in the context of discussions on long-term climate change. For this reason, more caution is needed in the interpretation of projection results for the near future.
 |
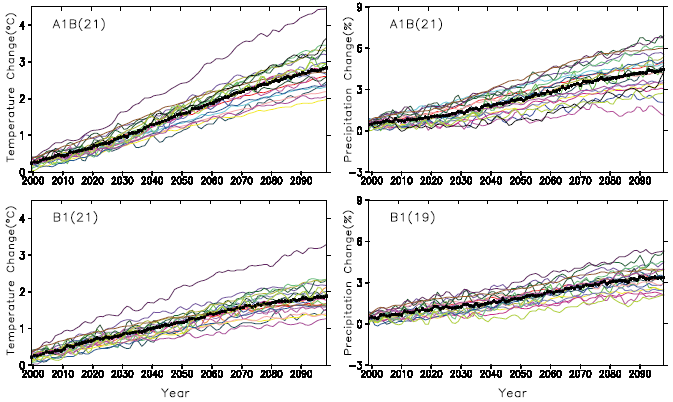
The IPCC Fourth Assessment Report (IPCC 2007) summarized long-term trends of climate change in the future based on data from more than 20 coupled global circulation models. Figure 1.3-4 shows the long-term trends of global temperature and precipitation projected by these models. The results show a wide spread between the most and least sensitive models. Although climate sensitivity estimated from model experiments and observations is likely to range from 2 to 4.5 K (IPCC 2007), it is not possible to exclude the possibility that it will fall outside this range because significant uncertainty arises from the cloud-system feedback effect.
In addition, uncertainty caused by the carbon feedback cycle (which results in increased amounts of anthropologic carbon dioxide in the atmosphere due to reduced efficiency of carbon dioxide absorption by land and oceans in response to global warming) can lead to significant uncertainty in future projections of CO2 concentration.
In general, these future climate projection uncertainties can be estimated via multi-model or multi-parameter experiments. However, it should be noted that quantitative uncertainty estimation is not fully investigated in GWPV8 because the atmospheric component of the model used is based on a single-model, single-scenario experiment.
 |
Climate models cannot reproduce nature perfectly because their process involves various assumptions and approximations for computational convenience. This makes model-dependent systematic errors and biases inevitable. As a result, raw as-is outputs from climate models do not stand up to straightforward naive interpretation and analysis. Systematic errors and biases can be reduced to some extent by applying statistical bias correction or by compiling statistics in terms relative to the present climate rather than in absolute terms (e.g., focusing on differences between the future and present climates). However, these methods are based on the assumption that systematic errors and biases in present climate projections will also appear in future projections.
Additionally, the topography used in the NHRCM (mountains, coastlines and urban areas) is simply an approximation rather than a perfect copy of actual conditions. In this context, it should be emphasized again that the numerical experiments detailed in GWPV8 were conducted using model topography.
In general, the smallest spatial scale that can be represented by a numerical model is a few times as large as the model grid size. Accordingly, large-scale patterns averaged over a broader area provide a more meaningful picture than changes on a single-grid scale.
Projections of precipitation are strongly affected by the frequency and intensity of extreme events such as tropical cyclones and heavy rain during the Baiu period (Japan's rainy season from June to July). In general, detecting climatological trends for precipitation is more difficult than that for temperature because extreme rainfall events are rare by definition and occur on relatively limited spatial and temporal scales. To increase the number of samples and reduce uncertainty, statistics on precipitation projection need to be compiled from data covering a broader region.
The future projection data provided in GWPV8 are based on numerical experiments conducted under the IPCC SRES A1B . The results may change significantly if another emission scenario such as the SRES A2 or B 1 were used. In addition, it is important to note that greenhouse gases emissions, which are strongly dependent on future social and economic developments, are also subject to significant uncertainty.
Despite the climate projection uncertainties described above, the use of climate model data is essential for quantitative projection of global warming because such information allows scientific and logical consideration of future climate system conditions. Use of the results outlined in GWPV8 as well as the outcomes of other climate projection projects such as the IPCC Fourth Assessment Report is expected to facilitate mitigation and adaptation planning, raise public awareness of the science behind climate change and further promote basic research activities.
Work to mitigate the uncertainties highlighted in this section is important in promoting international negotiations on reducing greenhouse gas emissions. In particular, uncertainty in relation to climate sensitivity must be addressed for accurate estimation to determine the stabilizing level of greenhouse gas concentration needed to prevent dangerous anthropogenic interference with the climate system. It is also important to reduce uncertainty in terms of carbon circulation change associated with global warming in order to support estimation of the greenhouse gas emissions required to stabilize concentration. To reduce these uncertainties, it is important to develop more refined climate models and monitor the atmosphere, oceans and ecological systems in a sustained manner.
1.2 Stastical method and region <<Previous page | Next page>> 1.4 Evaluation of NHRCM