GTSPP Data Product CentreGTSPP Data Product Centre
GTSPP Data Product Centre for the North Pacific Region hosted by the Japan Meteorological Agency
E.R. WILHELMSHAVEN(ELZY3), PX09
Observation period : 2015/5/11 to 2015/5/22
Observation period : 2015/5/11 to 2015/5/22
This page shows results for the PX09 line based on monitoring by the E.R. WILHELMSHAVEN and comparison with the result of assimilation by MOVE-NP.
Overall statistics
| Number of profiles | Number of data | AVE | RMSD | MAXD | MIND |
|---|---|---|---|---|---|
| 219 | 34013 | -0.05 | 0.69 | 4.18 | -6.45 |
Abbreviations in the table indicate:
AVE: average difference (observation value minus assimilation value)
RMSD: root mean square of difference
MAXD: maximum difference
MIND: minimum difference
Statistics for each depth range
| Depth range | Number of data | AVE | RMSD | MAXD | MIND |
|---|---|---|---|---|---|
| 0-50 | 2600 | 0.12 | 1.32 | 0.81 | -4.35 |
| 50-100 | 2600 | -0.34 | 1.07 | 3.14 | -6.45 |
| 100-150 | 2600 | -0.26 | 1.14 | 3.56 | -4.96 |
| 150-200 | 2600 | -0.26 | 0.94 | 3.93 | -3.62 |
| 200-250 | 2600 | -0.14 | 0.67 | 4.05 | -3.17 |
| 250-300 | 2591 | -0.03 | 0.35 | 4.18 | -2.64 |
| 300-350 | 2575 | -0.01 | 0.30 | 1.02 | -1.48 |
| 350-400 | 2575 | -0.03 | 0.33 | 0.60 | -1.16 |
| 400-450 | 2575 | -0.02 | 0.36 | 0.74 | -1.20 |
| 450-500 | 2575 | 0.06 | 0.22 | 0.88 | -1.08 |
| 500-550 | 1030 | 0.06 | 0.30 | 1.04 | -0.93 |
| 550-600 | 1030 | 0.04 | 0.28 | 1.11 | -0.82 |
| 600-650 | 1030 | 0.06 | 0.25 | 1.21 | -0.71 |
| 650-700 | 1030 | 0.06 | 0.23 | 1.00 | -0.64 |
| 700-750 | 1030 | 0.07 | 0.22 | 1.13 | -0.55 |
| 750-800 | 1030 | 0.07 | 0.21 | 1.22 | -0.44 |
| 800-850 | 1030 | 0.07 | 0.16 | 1.41 | -0.40 |
| 850-900 | 832 | 0.07 | 0.06 | 1.14 | -0.34 |
| 900-950 | 80 | 0.15 | 0.00 | 0.85 | -0.19 |
| 950-1000 | 0 | - | - | - | - |
Results of QC
A total of 219 profiles (100364 data, reported by BATHY or TESAC) were received from the E.R. WILHELMSHAVEN.
The results of JMA quality control are as follows.
The results of JMA quality control are as follows.
- Grounded test
- Position on land test
- Regional range test
- Gradient test
Error data: 234 of 100364
On land: 0 of 219
Invalid position: 0 of 219
Error data (low): 0 of 100364
Error data (high): 8 of 100364
Error data: 55 of 100364
For datails of JMA's quality control procedures, please refer to this page.
Summary of QC
- Some erroneous profiles are detected by JMA's automated quality control procedures. These are checked by the grounded test, regional range test and the gradient test. The main cause will be "hitting bottom" of XBT.
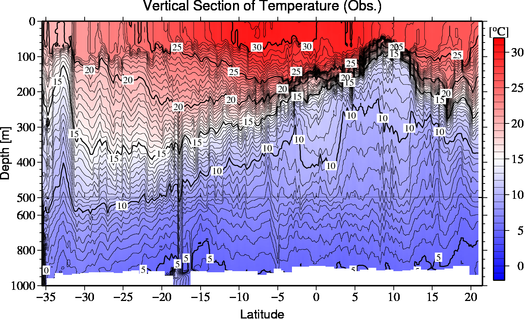
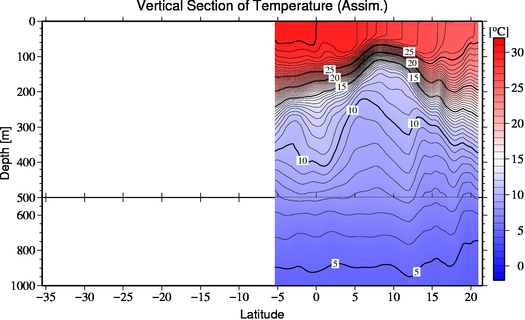
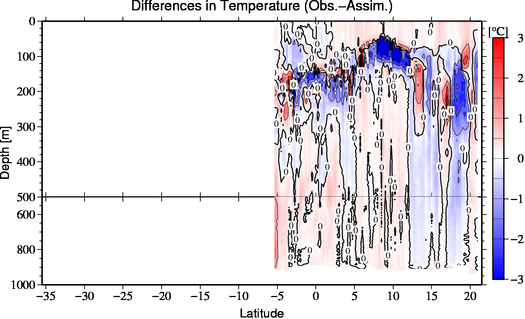
- There are large differences at depths of between 100 and 200m. The observation data shows sharper thermocline better than the assimilation data.
- With the exception of the above errors and differences, there were no significant biases in comparison with the results of assimilation by JMA.
Figures
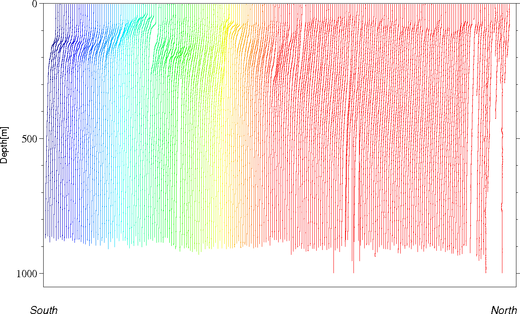
| ◊Station map | ◊Vertical temperature profile Vertical profile of temperature along the observing line of PX09 moved the entire profile by 5 degree Celsius. |
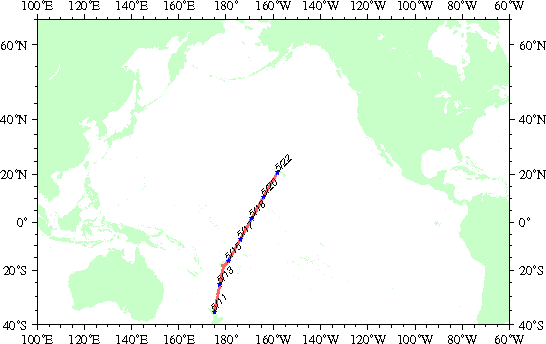 |
 |
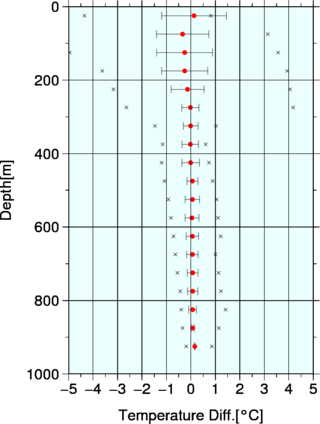
| ◊Vertical observation sections | ◊Summary of differences (Obs. - Assim.) by depth Dots and error bars represent the averages and root mean squares of the differences, respectively. Crosses represent the maximum/minimum differences. |
 |
 |
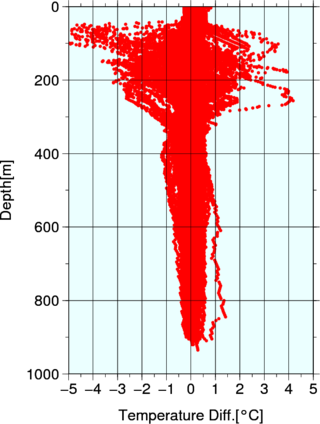
| ◊Vertical sections for the result of assimilation by MOVE-NP | ◊Distribution of differences (Obs. - Assim.) by depth |
 |
 |
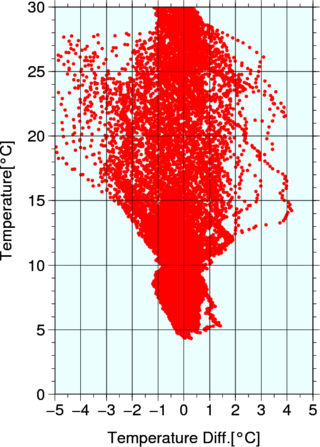
| ◊Vertical sections of differences (Obs. - Assim.) | ◊Distribution of differences (Obs. - Assim.) by temperature |
 |
 |
Correspondence to the web page should be addressed to