jma_logo Welcome to TCC wmo_logo
Home
World Climate
Climate System Monitoring
El Niño Monitoring
NWP Model Prediction
Global Warming
Climate in Japan
Training Module
Press release
Links
HOME >Climate System Monitoring > Monthly Highlights on the Climate System

Monthly Highlights on the Climate System

'Monthly Highlights on the Climate System' has been issued since March 2007 as a monthly bulletin focusing on the monthly highlights of the monitoring results.

Notice: Products have been upgraded from PDF to HTML format starting from the issue of May 2025 for improved accessibility.


Highlights in March 2026

- In the tropical Pacific, notably positive sea surface temperature (SST) anomalies were observed in the western region and off the west coast of South America, while weak negative anomalies remained around 150°W (Fig. 4). The NINO.3 index was +0.3°C (Fig. 5). Significantly positive SST anomalies were also widely observed across the Pacific and the tropical Indian Ocean.
- In the tropics, convective activity was extremely enhanced over eastern Africa. It was also enhanced from the eastern part of the Maritime Continent to the western Pacific, with particularly strong enhancement along 15°N (Fig. 6). Meanwhile, convective activity was suppressed from the Indian Ocean to the western Maritime Continent and from the central to the eastern Pacific, with extremely suppressed convective activity over the equatorial Indian Ocean.
- In the tropical upper troposphere, a pair of cyclonic anomalies straddling the equator dominated over the Indian Ocean and the eastern Pacific (Fig. 8). In the tropical lower troposphere, a pair of cyclonic anomalies straddling the equator was observed from the eastern Maritime Continent to the western Pacific, while a pair of anticyclonic anomalies straddling the equator was observed over the Indian Ocean and from the central to the eastern Pacific (Fig. 9). Sea level pressure anomalies were negative over all equatorial regions. In the subtropics, a north–south asymmetry was observed, with positive anomalies in the Southern Hemisphere and negative anomalies in the Northern Hemisphere.
- In the Northern Hemisphere, the zonal-mean subtropical jet shifted remarkably southward relative to its climatological position, and the polar-front jet was extremely stronger than normal along 60°N (Fig. 11).
- In the 500 hPa height field, the polar vortex split, with its centers located over northeastern Canada and central Siberia. Over North America, remarkably negative height anomalies dominated in high latitudes, while remarkably positive height anomalies dominated in middle latitudes (Fig. 10). Remarkably positive height anomalies were observed around the Kamchatka Peninsula, and positive height anomalies extended across the mid latitudes of Eurasia.
- In the sea level pressure (SLP) field, the Icelandic Low was stronger than normal, with remarkably negative anomalies to the south of Greenland (Fig. 12). Meanwhile the Aleutian Low was not seen with remarkably positive anomalies over the Bering Sea.
- Above-normal temperatures were observed throughout Japan and were particularly significant in northern Japan (Fig. 1). The monthly anomaly of the average surface temperature over Japan was +1.36°C. Precipitation amounts were significantly below normal on the Sea of Japan side of northern Japan and below normal on the Sea of Japan side of eastern Japan and in Okinawa/Amami. Sunshine durations were significantly above normal in western Japan and on the Sea of Japan sides of eastern Japan and above normal on the Pacific side of northern and eastern Japan and in Okinawa/Amami.

Climate in Japan (Fig. 1):

- Monthly mean temperatures were significantly above normal in northern Japan and above normal in eastern/western Japan and Okinawa/Amami due to being covered by warm air.
- The monthly anomaly of the average surface temperature over Japan was +1.36°C (6th warmest for March since 1898). On a longer time scale, the average surface temperatures have risen at a rate of about 1.91°C per century in March.
- Monthly precipitation amounts were significantly below normal on the Sea of Japan side of northern Japan, and below normal on the Sea of Japan side of eastern Japan and in Okinawa/Amami due to being less affected by low-pressure systems.
- Monthly sunshine durations were significantly above normal on the Sea of Japan side of eastern/western Japan and on the Pacific side of western Japan, and above normal on the Pacific side of northern/ eastern Japan and in Okinawa/Amami due to being frequently covered by high-pressure systems.

World Climate:

- The monthly anomaly of the global average surface temperature (i.e., the combined average of the near-surface air temperature over land and the SST) was +0.47°C (6th warmest for March since 1891) (preliminary value) (Fig. 2). On a longer time scale, global average surface temperatures have risen at a rate of about 0.92°C per century in March (preliminary value).
- Extreme climate events were as follows (Fig. 3).
  - Monthly mean temperatures were extremely high from Eastern Siberia to northern Japan, in and around Pakistan, in and around northern Europe and in northern Mexico.
  - Monthly mean temperatures were extremely low in Canada.
  - Monthly precipitation amounts were extremely high in Central Siberia, in central part of China, around the Mediterranean Sea and in central Australia.
  - Monthly precipitation amounts were extremely low in and around eastern Europe.

Oceanographic Conditions:

- In the equatorial Pacific, remarkably positive SST anomalies were observed in the western parts and off the west coast of South America, while weak negative SST anomalies were observed around 150°W (Fig. 4). The monthly mean SST anomaly averaged over the NINO.3 region and the SST deviation from the latest sliding 30-year mean over the region were +0.3℃ (Fig. 5).
- In the North and the South Pacific, positive SST anomalies were widely observed except for negative anomalies in the western North Pacific between 15°N and 30°N, with many areas displaying remarkably positive anomalies.
- In the Indian Ocean, positive SST anomalies were widely observed except for negative anomalies from the central to the western parts along 20°S, with many areas displaying remarkably positive anomalies.
- In the North Atlantic, south of 40°N, remarkably positive SST anomalies were observed in the western part, while negative anomalies were observed in the eastern part. Between 40° and 60°N, negative SST anomalies were observed in the western part, while remarkably positive anomalies were observed in the eastern part.
- In the South Atlantic, remarkably positive SST anomalies were seen in a wide area from the tropics to mid-latitudes.

Tropics:

- Convective activity was extremely enhanced over eastern Africa and along 15°N in the western Pacific and was also enhanced from the eastern Maritime Continent to the western Pacific. It was suppressed from the Indian Ocean to the western Maritime Continent and from the central to the eastern Pacific, with particularly strong suppression along the equator over the Indian Ocean (Fig. 6).
- The global distribution of convective activity anomalies exhibited a wave-number-2 pattern. One active phase of the equatorial intraseasonal oscillation migrated from the eastern Pacific to the Indian Ocean, while another slowly moved from the western Pacific to the central Pacific (Fig. 7).
- In the upper troposphere, cyclonic circulation anomalies straddling the equator were observed over the Indian Ocean and the eastern Pacific. A wavy anomaly pattern extended from the tropical western North Pacific, where anticyclonic circulation anomalies prevailed, to southern North America, also dominated by anticyclonic anomalies, passing through the vicinity of Hawaii, where cyclonic circulation anomalies were evident (Fig. 8).
- In the lower troposphere, cyclonic circulation anomalies straddling the equator were seen from the eastern Maritime Continent to the western Pacific, while anticyclonic circulation anomalies straddling the equator were seen over the Indian Ocean and from the central to the eastern Pacific (Fig. 9).
- In the sea level pressure field, negative anomalies were dominant in the equatorial region. Over the subtropical Indian Ocean and the subtropical Pacific, sea level pressure anomalies exhibited a north–south asymmetry, with negative anomalies in the Northern Hemisphere and positive anomalies in the Southern Hemisphere. The Southern Oscillation Index value was +1.0 (Fig. 5).

Extratropics:

- In the 500-hPa height field (Fig. 10), the polar vortex split into two, with centers located over northeastern Canada and central Siberia. In the Western Hemisphere, remarkably positive anomalies were observed in the high latitudes, while negative anomalies prevailed in the midlatitudes. In the Eastern Hemisphere, remarkably positive anomalies were observed around the Kamchatka Peninsula, and positive anomalies extended into the midlatitudes, whereas negative anomalies were evident over central Siberia. Between 20°N and 30°N over Africa and from the western to the central Pacific, remarkably negative anomalies were observed.
- The subtropical jet stream shifted significantly southward on a global scale, and the polar front jet stream was remarkably stronger than normal. In contrast, westerlies were significantly weaker than normal in the mid-latitudes (Fig. 11).
- In the sea level pressure field (Fig. 12), the Icelandic Low was located south of Greenland with remarkably negative anomalies, while a blocking high remained over the Bering Sea with remarkably positive anomalies, indicating the absence of the Aleutian Low. Between 20°N and 30°N over the Pacific, remarkably positive anomalies were observed.
- In the 850-hPa temperature field (Fig. 13), the anomaly pattern closely resembled that of the 500-hPa height field. Remarkably negative anomalies were observed over northern Canada, while remarkably positive anomalies were seen over the United States and around the Kamchatka Peninsula.
- In the stratosphere, the circulation anomaly pattern exhibited a wave-number-2 structure, and the polar vortex split into two centers over Canada and Siberia.

Zonal mean:

- In the zonal-mean zonal wind in the troposphere, the subtropical jet stream in the Northern Hemisphere shifted extremely southward compared with the climatological normal. Westerlies were significantly stronger than normal around 60°N, while they were significantly weaker than normal around 40°N.
- The zonal-mean temperatures in the troposphere were remarkably above normal in the midlatitudes, and temperatures derived from thickness recorded the highest value on record, while negative temperature anomalies were observed around 65°N and in the subtropics.

Supplemental information

- Climate Anomaly Table over Japan
- Extratropics in the Southern Hemisphere
- Snow in the Northern Hemisphere
- Arctic sea ice (link to the National Snow and Ice Data Center)

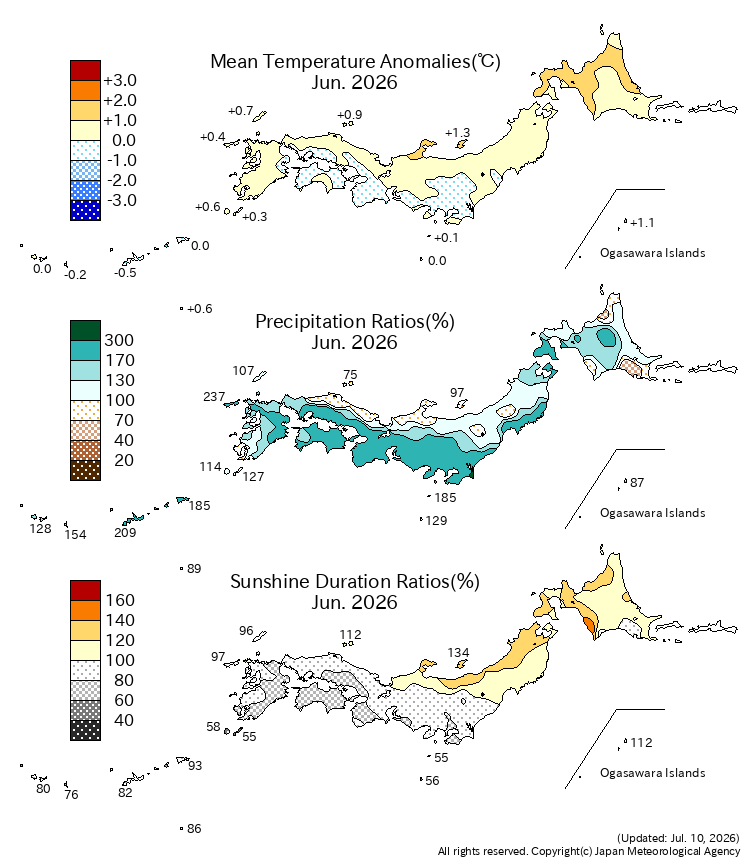
Fig.1 Monthly climate anomaly/ratio over Japan (March 2026)
Top: temperature anomalies (degree C)
Middle: precipitation ratio (%)
Bottom: sunshine duration ratio (%)
The base period for the normal is 1991-2020.


Fig.2 Long-term change in monthly anomalies of global average surface temperature in March
The thin black line indicates anomalies of the surface temperature in each year. The blue line indicates five-year running mean, and the red line indicates a long-term linear trend. Anomalies are deviations from the 1991-2020 average.


Fig.3 Distribution of extreme climate stations (March 2026)


Fig.4 Monthly mean sea surface temperature anomaly (March 2026)
The contour interval is 0.5 degree C. The base period for the normal is 1991-2020. Maximum coverage with sea ice is shaded in gray.


Fig.5 Time series of monthly mean SST departure (degree C) from the reference value defined as the immediate past 30-year mean SST averaged over the NINO.3 region (upper). Time series of the Southern Oscillation Index with respect to the 1991-2020 base period (lower).
Thin blue lines represent monthly means and thick blue lines five-month running means. Periods of El Niño and La Niña events are shown as red-colored and blue-colored boxes, respectively.


Fig.6 Monthly mean Outgoing Longwave Radiation (OLR) anomaly (March 2026)
The shading interval is 10 W/m2. The base period for the normal is 1991-2020. Original data (CPC Blended OLR) are provided by NOAA.

Fig.7 Time-Longitude cross section (5°N-5°S) of five-day running mean 200-hPa velocity potential anomaly (left) and 850-hPa zonal wind anomaly (right) (October 2025 - March 2026)
The contour intervals are 4x10⁶ m2/s (left) and 2 m/s (right). The base period for the normal is 1991-2020.


Fig.8 Monthly mean 200-hPa stream function and anomaly (March 2026)
The contour interval is 10x106 m2/s. The base period for the normal is 1991-2020.


Fig.9 Monthly mean 850-hPa stream function and anomaly (March 2026)
The contour interval is 2.5x10⁶ m2/s. The base period for the normal is 1991-2020.


Fig.10 Monthly mean 500-hPa height and anomaly in the Northern Hemisphere (March 2026)
The contours show 500-hPa height at intervals of 60 m. The shading indicates its anomalies. The base period for the normal is 1991-2020.

Fig.11 Monthly mean 200-hPa wind speed and vectors in the Northern Hemisphere (March 2026)
The black lines show wind speed at intervals of 15 m/s. The brown lines show its normal at intervals of 30 m/s. The base period for the normal is 1991-2020.

Fig.12 Monthly mean sea level pressure and anomaly in the Northern Hemisphere (March 2026)
The contours show sea level pressure at intervals of 4 hPa. The shading indicates its anomalies. The base period for the normal is 1991-2020.

Fig.13 Monthly mean 850-hPa temperature and anomaly in the Northern Hemisphere (March 2026)
The contours show 850-hPa temperature at intervals of 4 degree C. The shading indicates its anomalies. The base period for the normal is 1991-2020.

Back Number


The descriptions from May-2011 to April-2021 issue are based on the former climatological normal (1981-2010 average).
In the descriptions until April-2011 issue, 1979-2004 average is used as climatological normal unless otherwise stated.
The descriptions until January-2014 issue are based on the JRA-25/JCDAS datasets.
The descriptions from February-2014 to April-2023 issue are based on the JRA-55 reanalysis.

Figures and Tables

Notice: Products based on JRA-3Q were updated to those with improved quality in terms of tropical cyclone analysis. OLR-related products from January 1991 are based on NOAA CPC Blended OLR (CBO).

Notice: Figures of 'Atmospheric Circulation', 'Time Cross Section', and 'Indices' have been revised with improved quality data regarding tropical cyclone analysis. (18 June 2024)

Notice: Depending on the availability of NOAA CPC Blended OLR (CBO) data, updates may be delayed or figures may be filled with gray indicating data missing.


If you would like to subscribe to Monthly Highlights on the Climate System, please send an email to

with your name, affiliation, country and email address.
page top

Tokyo Climate Center, Climate Prediction Division.
Copyright(C) 2002. Japan Meteorological Agency. - Legal Notice -