jma_logo Welcome to TCC wmo_logo
Home
World Climate
Climate System Monitoring
El Niño Monitoring
NWP Model Prediction
Global Warming
Climate in Japan
Training Module
Press release
Links
HOME > El Niño and Indian Ocean Dipole > Indian Ocean Dipole (IOD) / Historical IOD Events

Indian Ocean Dipole (IOD)

The Indian Ocean Dipole (IOD) (Saji et al. 1999) is an inherent mode of climate variability over the Indian Ocean, independent of El Niño/La Niña phenomena. It is characterized by sea surface temperature (SST) anomalies and associated convective anomalies with opposite signs in the eastern and western tropical Indian Ocean. In the positive IOD phase, lower-than-normal SSTs and suppressed convective activity are seen in the southeastern part of the tropical Indian ocean, while SSTs in the western part of the ocean are higher-than-normal with accompanying enhanced convection. Negative IOD events have anomalies with signs opposite to those of its positive phase.

Figure 1 shows typical anomalies of SST and lower-tropospheric circulation associated with "pure" (i.e., with an absence of El Niño conditions in the Pacific) positive IOD events in the mature stage. A clear east-west contrast of SST anomalies is seen in the tropical Indian Ocean together with lower-troposphere anti-cyclonic circulation anomalies straddling the equator.

IOD Anomalies

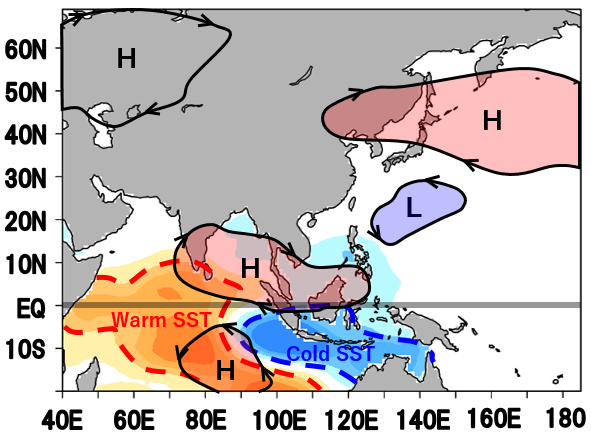
Figure 1. Typical anomalies of SST and lower-tropospheric circulation associated with pure positive IOD events in the mature stage. H and L denote anti-cyclonic and cyclonic circulation anomalies, respectively.


Historical IOD Events

JMA uses the dipole mode index (DMI) to monitor IOD events. The DMI is based on differences in area-averaged monthly-mean SST deviations between the tropical western Indian Ocean [50 - 70ºE, 10 ºS- 10ºN] (denoted as the WIN area in Figure 2) and the southeastern tropical Indian Ocean [90 - 110ºE, 10ºS - Equator] (denoted as the EIN area in Figure 2), with monthly-mean SST deviation based on linear extrapolation with respect to the latest sliding 30-year mean for each calendar month. Positive and negative IOD events generally both occur in boreal summer and autumn (from June through November). Positive (negative) IOD events are identified when the three-month running mean DMI is +0.4ºC or above (-0.4ºC or below) for at least three consecutive months between June and November.

The table 1 shows historical IOD events observed since 1949. Those in concurrence with El Niño (La Niña) events (indicated by red and blue bold text, respectively) were excluded in statistical surveys for Composite maps for IOD and IOD impacts on the global climate.


Table 1. Historical IOD events observed since 1949
Red (blue) bold text indicates positive (negative) IOD events in concurrence with El Niño (La Niña) events, while red (blue) backgound indicates pure positive (negative) IOD events (i.e., with an absence of El Niño (La Niña) conditions). Please note that there are some cases in which these colorings regarding ENSO are provisional for the event in the last few months until the start or end of the concurrent El Niño/La Niña event is determined. Winter, spring, summer and autumn mean December to February, March to May, June to August, and September to November, respectively.

Positive IOD Negative IOD
summer 1958 - autumn 1958
summer 1961 - autumn 1961
summer 1963 - autumn 1963
summer 1967 - autumn 1967
summer 1972 - autumn 1972 autumn 1975
summer 1982 - autumn 1982 summer 1984 - autumn 1984
summer 1985
summer 1992 - autumn 1992
summer 1994 - autumn 1994 summer 1995 - autumn 1995 (concurrent La Niña event in autumn)
summer 1996 - autumn 1996
summer 1997 - autumn 1997 summer 1998 - autumn 1998 (concurrent La Niña event in autumn)
summer 2005 - autumn 2005
autumn 2006
summer 2007 - autumn 2007
summer 2010 - autumn 2010
summer 2012 - autumn 2012
summer 2015 - autumn 2015 summer 2016 - autumn 2016
summer 2017 - autumn 2017
summer 2018 - autumn 2018 (concurrent El Niño event in autumn)
summer 2019 - autumn 2019 summer 2020 - autumn 2020
summer 2021 - autumn 2021 (concurrent La Niña event in autumn)
summer 2022 - autumn 2022
summer 2023 - autumn 2023

IOD Regions

Figure 2. Regions for IOD monitoring indices

Time series of DMI

Figure 3 shows DMI time series. IOD occurrence frequency varies significantly over time, with greater frequency in the positive phase since 2000.
The DMI is derived from datasets of MGDSST (Kurihara et al. 2006) after June 2015 and those of COBE-SST2 (Hirahara et al. 2014) before May 2015.

Dipole Mode Index

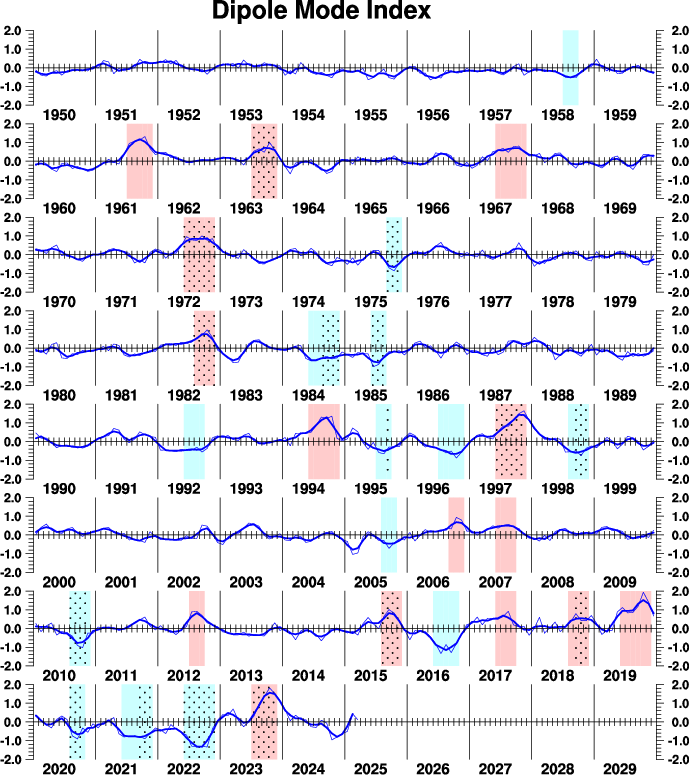
Figure 3. Dipole Mode Index (DMI) time series representation
The thin and thick lines indicate monthly mean and three-month running mean DMI, respectively, while red and blue shading denotes positive and negative IOD periods, respectively. Hatched areas indicate positive and negative IOD events in concurrence with El Niño and La Niña events, respectively. These events were excluded in the statistical surveying of Composite maps for IOD and IOD impacts on the global climate.


References

  • Hirahara, S., M. Ishii, and Y. Fukuda, 2014: Centennial-scale sea surface temperature analysis and its uncertainty. J. Climate, 27, 57-75.
  • Kurihara, Y., T. Sakurai, and T. Kuragano, 2006: Global daily sea surface temperature analysis using data from satellite microwave radiometer, satellite infrared radiometer and in-situ observations. Weather Service Bulletin, 73, Special issue, s1-s18 (in Japanese).
  • Saji, N., Goswami, B., Vinayachandran, P. and T. Yamagata, 1999: A dipole mode in the tropical Indian Ocean, Nature, 401, 360-363, doi.org/10.1038/43854.
  • page top

    Tokyo Climate Center, Climate Prediction Division.
    Copyright(C) 2002. Japan Meteorological Agency. - Legal Notice -