 |
|
|||
Home |
World Climate |
Climate System Monitoring |
El Niño Monitoring |
NWP Model Prediction |
Global Warming |
Climate in Japan |
Training Module |
Press release |
Links |
The Standardized Precipitation Index (SPI) is commonly used for operational drought monitoring by National Meteorological and Hydrological Services (NMHSs) around the world to quantify precipitation deficits on multiple timescales. Related calculation for specific locations is based on long-term precipitation records for the target period. The ability to compute index values on numerous time scales makes this metric useful in the quantification of risk regarding various types of droughts (e.g., meteorological, agricultural and hydrological). The need for only precipitation data as an input parameter facilitates SPI computation. However, it should be noted that no evapotranspiration effect is considered.
Refer to the WMO's SPI User Guide (WMO, 2012) for details of the background of the index, its introduction and a related description.
Calculation of the SPI indices shown in the TCC ClimatView tool is based on monthly precipitation totals from CLIMAT data for states worldwide and on Global Historical Climatology Network (GHCN) data provided by the National Oceanic and Atmospheric Administration (NOAA)'s National Centers for Environmental Information (Peterson and Vose, 1997). Both sets of data are based on observations conducted at surface weather stations worldwide, but CLIMAT data are available only as far back as June 1982. Where both are available for the same station, CLIMAT data are applied. To derive probability distribution for past precipitation amounts, monthly precipitation data are used wherever possible for the period from 1950 to 2020. SPI values are not calculated if the available data span is shorter than 30 years. The ClimatView tool shows SPI values only as far back as June 1982.
TCC uses the SPI calculation program provided by Colorado State University in the USA. In SPI computation, the long-term record of past precipitation is fitted to probability distribution before transformation to normal distribution (Figure 1). Accordingly, the mean SPI for the location and desired period is zero (Edwards and McKee, 1997). Negative SPI values indicate precipitation below the median value. Drought events may occur when the SPI is continuously negative and reaches a certain value, such as -1.0 or less (McKee et al. 1993).
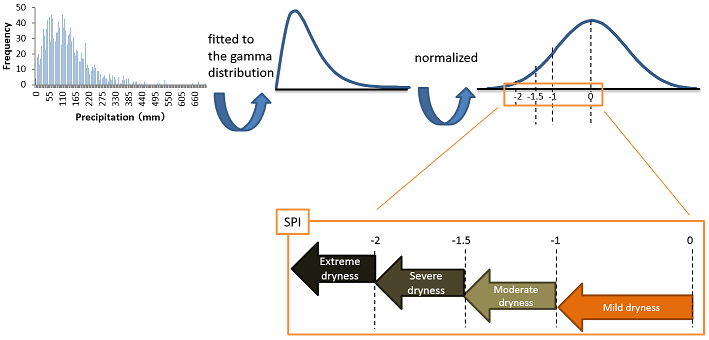
Figure 1. Schematic representation of SPI calculation
For this ClimatView resource, drought intensity categories and event severity as indicated by SPI values are shown in the table below.
| SPI | Category | Severity of event |
|---|---|---|
| 0 ~ -0.99 | Mild dryness | 1 in 3 years |
| -1.00 ~ -1.49 | Moderate dryness | 1 in 10 years |
| -1.5 ~ -1.99 | Severe dryness | 1 in 20 years |
| < -2.0 | Extreme dryness | 1 in 50 years |