 |
|
|||
Home |
World Climate |
Climate System Monitoring |
El Niño Monitoring |
NWP Model Prediction |
Global Warming |
Climate in Japan |
Training Module |
Press release |
Links |
The monthly anomaly of the global average surface temperature in October 2025 (i.e. the average of the near-surface air temperature over land and the SST) was +0.41°C above the 1991-2020 average (+0.93°C above the 20th century average), and was the 3rd warmest since 1891. On a longer time scale, global average surface temperatures have risen at a rate of about 0.73°C per century.
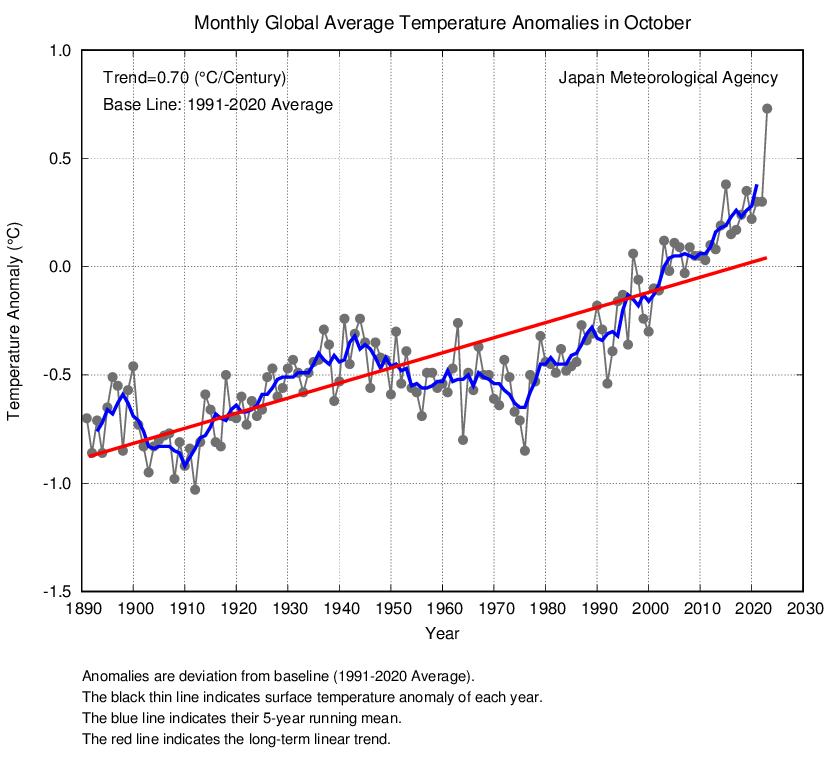
1st. 2023(+0.73°C), 2nd. 2024(+0.61°C), 3rd. 2025(+0.41°C), 4th. 2015(+0.38°C), 5th. 2019(+0.35°C)