 |
|
|||
Home |
World Climate |
Climate System Monitoring |
El Niño Monitoring |
NWP Model Prediction |
Global Warming |
Climate in Japan |
Training Module |
Press release |
Links |
| Area | Longitude/Longitude | |
|---|---|---|
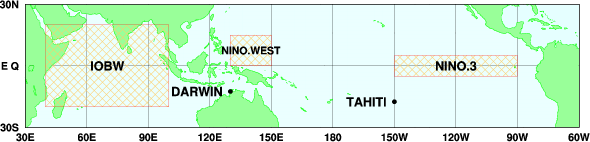
NINO.3 |
Eastern equatorial Pacific |
5°N–5°S, 150°W–90°W |
NINO.WEST |
Western tropical Pacific |
15°N–EQ, 130°E–150°E |
IOBW |
Tropicl Indian Ocean |
20°N–20°S, 40°E–100°E |
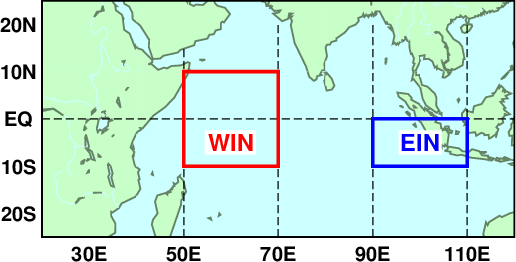
IOD |
Difference between WIN (western Indian Ocean) and EIN (eastern Indian Ocean) |
WIN: 10°S–10°N, 50°E–70°E |
 |
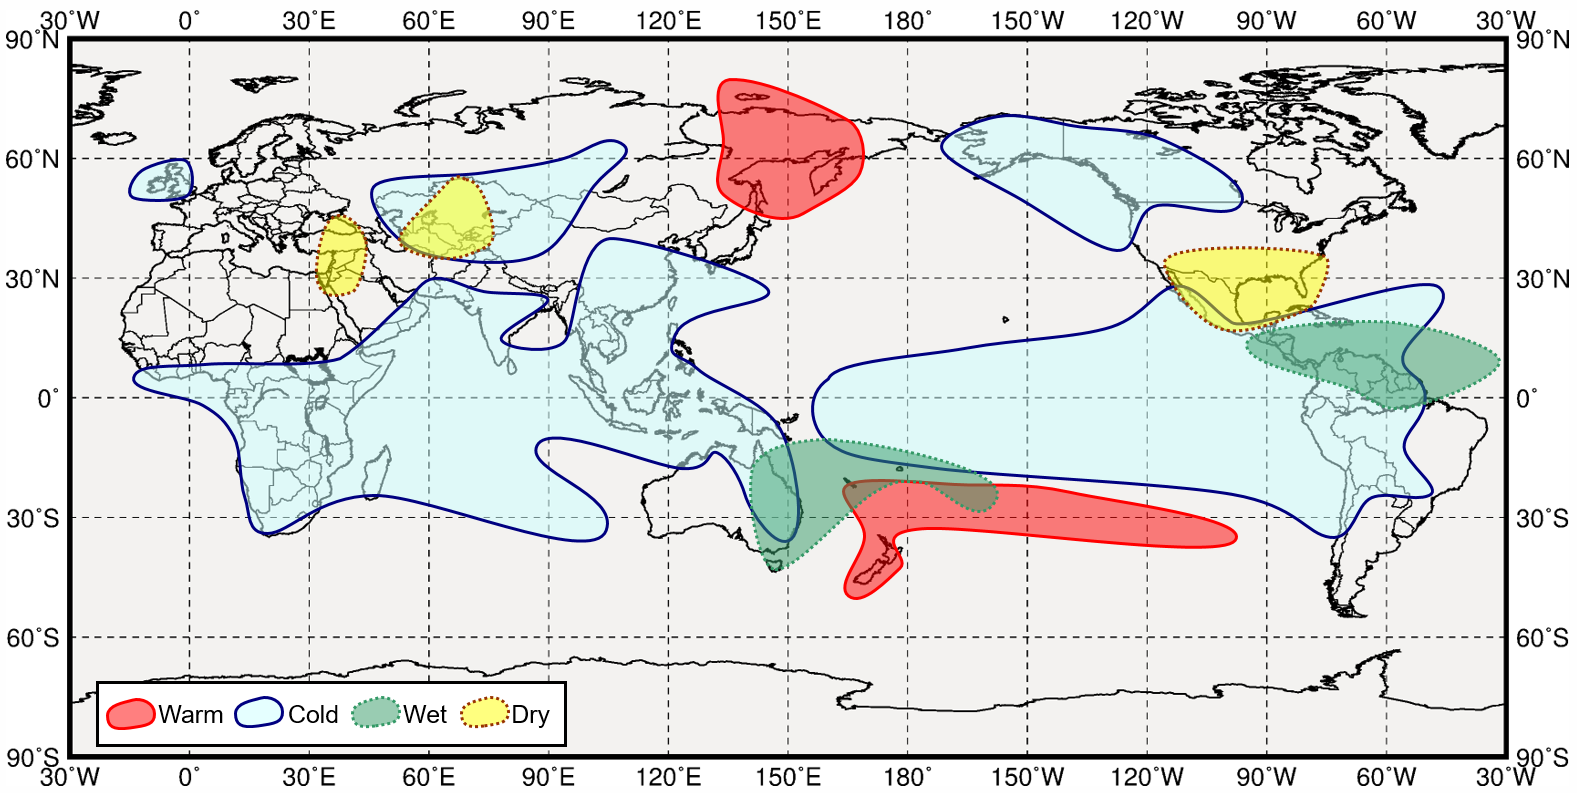 |
Impacts of El Niño in boreal winter |
Impacts of La Niña in boreal winter |