jma_logo Welcome to TCC wmo_logo
Home
World Climate
Climate System Monitoring
El Niño Monitoring
NWP Model Prediction
Global Warming
Climate in Japan
Training Module
Press release
Links
HOME > World Climate > Impacts of El Niño/La Niña and Indian Ocean Dipole events on the Global Climate > Data and Analysis Method

Data and Analysis Method

1. Data

(a) Temperatures and precipitation

This analysis was performed using monthly mean temperature information and precipitation totals from CLIMAT data as well as Global Historical Climatology Network (GHCN) data provided by the National Oceanic and Atmospheric Administration (NOAA)'s National Centers for Environmental Information (Peterson and Vose 1997; Menne et al. 2017). Both sets of data are based on observations conducted at surface weather stations worldwide. CLIMAT data are available only as far back as June 1982. Where both were available, CLIMAT data were used.

(b) Sea surface temperature

The COBE-SST2 analysis dataset (Hirahara et al. 2014) and the MGDSST dataset (Kurihara et al. 2006) produced by the Japan Meteorological Agency (JMA) were used for sea surface temperatures (SSTs).

(c) Other supporting data – reanalysis and satellite observation

2-m temperature and total precipitation rate data from the Japanese Reanalysis for Three Quarters of a Century (JRA-3Q; Kobayashi et al. 2021) were used to support and complement results from surface observation. Outgoing longwave radiation (OLR) data derived from polar-orbiting satellite observation conducted by NOAA were also used for estimates of convective activity.


2. Analysis Method

The period of the analysis was 1948–2021 (74 years) as described below.

(a) Indices of tropical SST variability

(a-1) NINO.3, NINO.WEST and IOBW

Indices relating to SST variability in NINO.3, NINO.WEST and IOBW were defined using area-averaged SST deviations, defined as departures from the latest sliding 30-year mean for NINO.3 and from linear extrapolation with respect to the latest sliding 30-year period for NINO.WEST and IOBW. The data are available at "Download El Niño Monitoring Indices".

Latitude Longitude

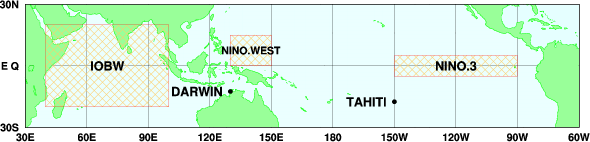
Eastern equatorial Pacific (NINO.3)

5°N–5°S

150°W–90°W

Western tropical Pacific (NINO.WEST)

15°N–EQ

130°E–150°E

Tropical Indian Ocean (IOBW)

20°N–20°S

40°E–100°E


El Niño events are identified when the five-month running NINO.3 SST mean is 0.5°C or above for at least six consecutive months, while La Niña events are identified when the same is -0.5°C or below. Indices relating to SST events in NINO.WEST or IOBW are identified in the same way, with thresholds of 0.15°C for warmer events and -0.15°C for cooler ones.


(a-2) Indian Ocean Dipole

The IOD Monitoring Indices used in this analysis and for the corresponding regions are shown in Table 2. The configuration for IOD-related regions is as per Saji et al. (1999). IOD events are identified using Dipole Mode Index (DMI) values, defined as differences in area-averaged monthly-mean SST deviations between the tropical western Indian Ocean [50 - 70°E, 10°S - 10°N] (denoted as WIN) and the southeastern tropical Indian Ocean [90 - 110°E, 10°S - Equator] (denoted as EIN). Monthly-mean SST deviations are departures from linear extrapolations with respect to the latest sliding 30-year mean for each calendar month. Positive and negative IOD events generally occur in boreal summer and autumn from June through November. Positive IOD events are identified when the three-month running mean DMI is +0.4°C or above for at least three consecutive months between June and November, while negative ones are identified for values of -0.4°C or below. For IOD-related composite maps, positive IOD events in concurrence with El Niño events and negative values for La Niña events were excluded to clarify actual climatic IOD effects. See also "Download Indian Ocean Dipole Monitoring Indices".


Latitude Longitude

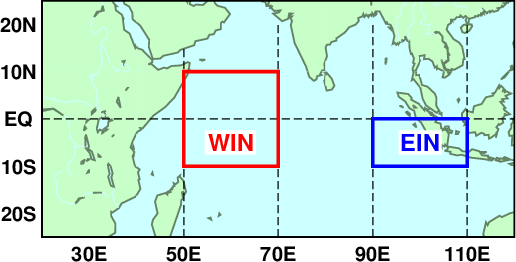
Western Indian Ocean (WIN)

10°N–10°S

50°E–70°E

Eastern Indian Ocean (EIN)

EQ–10°S

90°E–110°E

DMI (Dipole Mode Index)

Difference between WIN and EIN


(b) 5° x 5°- grid data on temperature and precipitation

Three-month running mean temperatures and precipitation totals for each station were derived from CLIMAT and GHCN data. Three-month averages and totals were produced only if all relevant data for three consecutive months were available. For each station, the temperature anomaly normalized by its standard deviation and the ratio of precipitation to its mean were calculated only if data availability was 50% or more for the analysis period. For levels of data availability between 50 and 80%, station data with biases on either side of El Niño/La Niña events (or warmer/cooler SST events in NINO.WEST or IOBW, pure positive/negative IOD events) were not retained. Station-based data were transformed into 5° x 5° grids via averaging for all stations located in grid cells. Here, the long-term linear trend of temperature was eliminated to exclude global warming effects.

(c) Classification thresholds

For all grids and three-month periods, temperature (precipitation) data were classified as "Low (Dry)", "Normal" or "High (Wet)" using thresholds based on the assumption of equal climatological probabilities for each class. The thresholds were set to give a 33% climatological probability for each class for most grids, but some values far exceeded this level. By way of example, the climatological probability of "Dry" was far above 33% in rain-scarce desert areas. The thresholds for "Dry" and "Normal" in such areas were based on the lowest non-zero value.

(d) Statistical testing

Statistical testing was performed to determine whether the probabilities of each class during El Niño and La Niña events (or warmer/cooler SST events in NINO.WEST or IOBW, pure positive/negative IOD events) exceeded climatological probability. The p-value for the appearance of each class was estimated via binominal testing. The class with the smallest p-value is shown in the chart with the corresponding color and mark. The results are shown in "Detailed Charts".

(e) Schematic charts

Based on the results of the above statistical testing, schematic charts were produced. Areas where three or more adjacent grids had equal tendencies with a confidence level of 90% or more were designated with a specific color. Composite analysis results for 2-m temperature, SST and OLR were also taken into particular account to determine colored areas where observation stations were sparsely distributed, such as oceanic areas.


References


Tokyo Climate Center, Climate Prediction Division.
Copyright(C) 2002. Japan Meteorological Agency. All rights reserved. - Copyright & Disclaimer -