| Type | Area | Remarks |
|---|
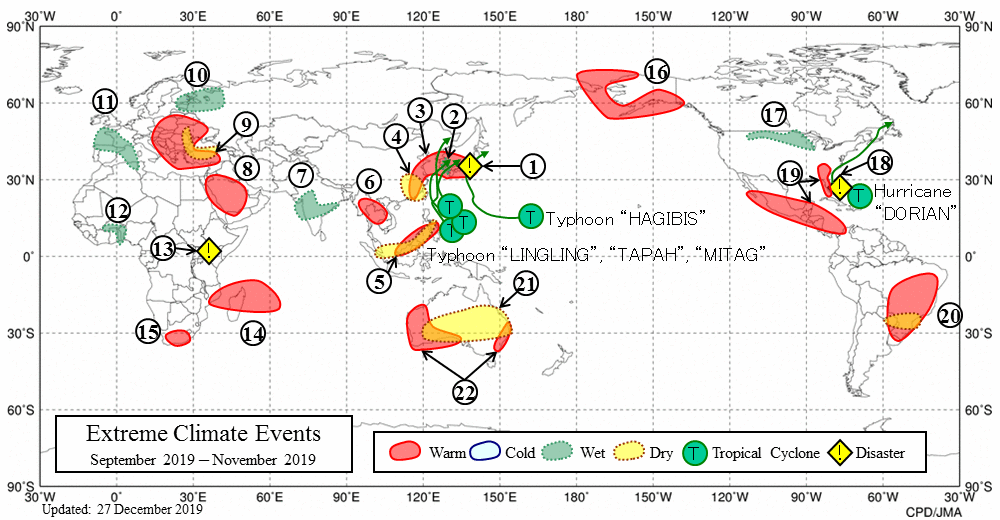
| 1 | Typhoon | From the Pacific side of northern Japan to the Pacific side of eastern Japan |
- Typhoon "HAGIBIS" caused a total of 85 fatalities from the Pacific side of northern Japan to the Pacific side of eastern Japan (Fire and Disaster Management Agency of Japan, as of 12 December 2019).
|
| 2 | Wet | In and around the southern part of the Korean Peninsula |
|
| 3 | Warm | From eastern Japan to southeastern China |
- The seasonal mean temperature in Republic of Korea in Autumn (from September to November) was the second highest for this season since 1973 (Korea Meteorological Administration, Republic of Korea).
|
| 4 | Dry | Southeastern China |
|
| 5 | Warm · Dry | The central part of Southeast Asia |
|
| 6 | Warm | The northwestern part of Southeast Asia |
|
| 7 | Wet | In and around central India |
- It was reported that heavy rains in September caused more than 360 fatalities in India (the government of India, European Commission).
|
| 8 | Warm | In and around Saudi Arabia |
|
| 9 | Warm · Dry | From eastern Europe to the northwestern part of the Middle East |
|
| 10 | Wet | From the northern part of Western Russia to southern Finland |
|
| 11 | Wet | From western Europe to the northern part of Northern Africa |
|
| 12 | Wet | The southern part of Western Africa |
|
| 13 | Heavy Rain | From the northern to central part of Eastern Africa |
- It was reported that heavy rains from October to November caused a total of more than 170 fatalities from the northern to central part of Eastern Africa (European Commission, UN Office for the Coordination of Humanitarian Affairs, UN Country Team in Djibouti).
|
| 14 | Warm | In and around Madagascar |
|
| 15 | Warm | From the central to southern part of South Africa |
|
| 16 | Warm | In and around Alaska |
|
| 17 | Wet | The northern USA |
- The seasonal precipitation amount in the Upper Midwest of the USA in Autumn (from September to November) was the highest for this season since 1895 (National Oceanic and Atmospheric Administration, the USA).
|
| 18 | Hurricane | From the eastern USA to the Bahamas |
- It was reported that Hurricane "DORIAN" caused more than 70 fatalities from the eastern USA to the Bahamas in September (the government of the USA and the Bahamas).
|
| 19 | Warm | The southeastern USA, From central Mexico to northern Colombia |
|
| 20 | Warm · Dry | In and around southern Brazil |
|
| 21 | Dry | Australia |
- The seasonal precipitation amount in Australia in Spring (from September to November) was the lowest for this season since 1900 (Bureau of Meteorology, Australia).
|
| 22 | Warm | The southeastern and southwestern parts of Australia |
|