 |
|
|||
Home |
World Climate |
Climate System Monitoring |
El Niño Monitoring |
NWP Model Prediction |
Global Warming |
Climate in Japan |
Training Module |
Press release |
Links |
|
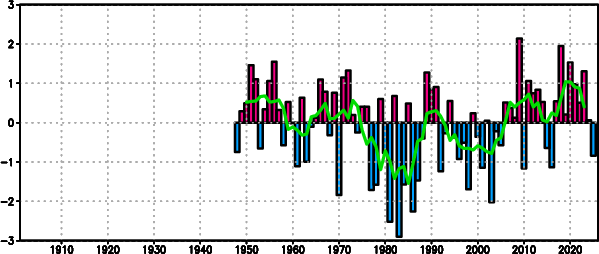
NPI time series
The bars represent five-month mean ( November - March ) NPI values based on JRA-3Q. The green line represents five-year running means of five-month mean NPI values. Positive (negative) NPI values indicate that the Aleutian Low is weaker (stronger) than its normal. For comparison with the PDO index, the period of the graph is adjusted to that of the PDO index.
|