Pacific Decadal Oscillation (PDO) index
Notice: PDO index time series data and graphs have been updated due to recalculation of the PDO index (23 January 2024).
Highlights
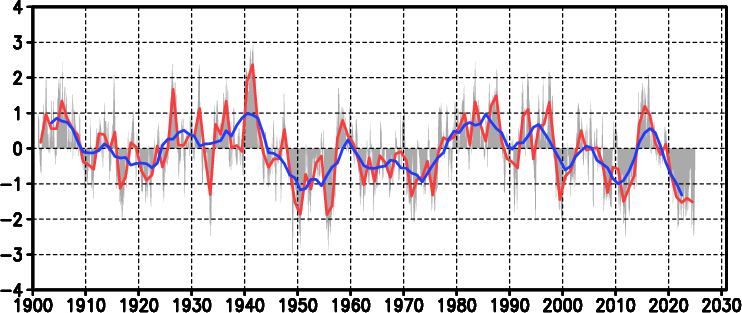
The Pacific Decadal Oscillation (PDO) index value for 2025 (annual mean) was -1.4. Focusing on the decadal variability of the PDO index, negative values were generally observed from around 2000 to the early 2010s, and positive values were generally observed in the late 2010s, while negative values have continued since around 2020 and have since persisted in a remarkably negative PDO.
|
Time-series of the PDO index
The red line represents annual mean values for the PDO index based on COBE-SST2,
the blue line represents five-year running mean values,
and the gray bars represent monthly valuies.
|
Commentary
The Pacific Decadal Oscillation (PDO) is an SST anomaly pattern of Pacific climate variability that shifts phases on an inter-decadal time scale usually covering more than 10 years. The PDO index is defined as the projections of monthly mean SST anomalies onto their first EOF vectors in the North Pacific (north of 20ºN). The EOF vectors are derived for the period from 1901 to 2000, and climatology is defined as monthly mean for the same period. Globally averaged monthly mean SST anomalies are subtracted from each monthly mean SST anomaly before calculation of the first EOF vector in order to eliminate the effects of global warming.
When the PDO index is positive (negative), SSTs in the central part of the North Pacific are likely to be lower (higher) than their normals (i.e., typical SST anomalies in the positive phase of the PDO). In addition, when the index is positive (negative), sea level pressures (SLPs) values in the high latitudes of the North Pacific are likely to be lower (higher) than their normals. This indicates that the Aleutian Low is stronger (weaker) than its normal in winter and spring (typical SLP anomalies in the positive phase of the PDO).
The Pacific Decadal Oscillation (PDO) index value for 2025 (annual mean) was -1.4.
Focusing on the decadal variability of the PDO index, values were generally positive (corresponding to a pattern in which SSTs in the central part of the North Pacific are lower than their normals) from the late 1920s to the early 1940s and from the late 1970s to around 2000, and generally negative from the late 1940s to the mid-1970s and from around 2000 to the early 2010s. Positive values were recorded in the late 2010s, while negative values have continued since around 2020 and have since persisted in a remarkably negative PDO. Based on suggestions from recent studies that PDO may be a key factor in the global climate system (including Japan's climate and the acceleration/hiatus of global warming), continuous monitoring of its variability is needed.
Tokyo Climate Center, Climate Prediction Division.
Copyright(C) 2002. Japan Meteorological Agency.
-
Legal Notice -